The mtext() function allows to write text in one of the
four margins of the current figure region or one of the outer
margins of the device region.
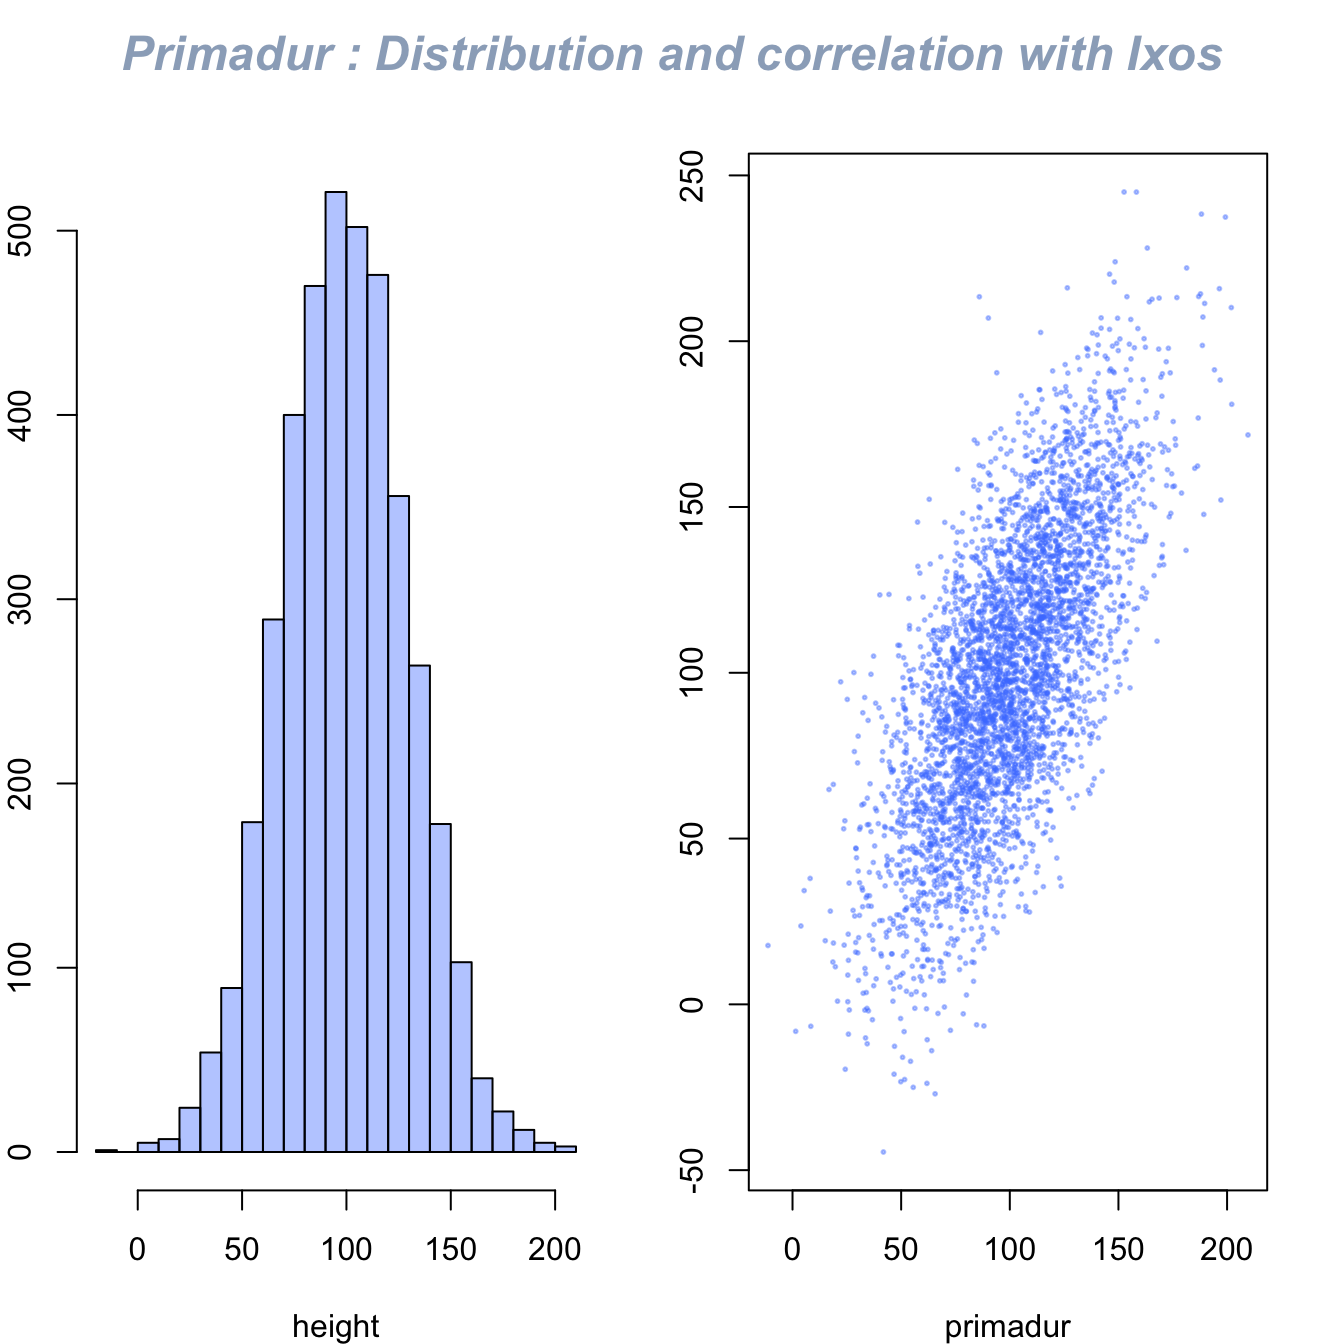
Here, the figure is first split thanks to par(mfrow..).
Then, only one title is added and centered using
mtext().
#Dummy data
Ixos <- rnorm(4000,100,30)
Primadur <- Ixos+rnorm(4000 , 0 , 30)

#Divide the screen in 1 line and 2 columns
par(
  mfrow=c(1,2),
  oma = c(0, 0, 2, 0)
)

#Make the margin around each graph a bit smaller
par(mar=c(4,2,2,2))

# Histogram and Scatterplot
hist(Ixos,  main="" , breaks=30 , col=rgb(0.3,0.5,1,0.4) , xlab="height" , ylab="nbr of plants")
plot(Ixos , Primadur,  main="" , pch=20 , cex=0.4 , col=rgb(0.3,0.5,1,0.4)  , xlab="primadur" , ylab="Ixos" )

#And I add only ONE title :
mtext("Primadur : Distribution and correlation with Ixos", outer = TRUE, cex = 1.5, font=4, col=rgb(0.1,0.3,0.5,0.5) )
Customizations
Here is a description of the most common customization:
cex: circle size-
xlimandylim: limits of the X and Y axis -
pch: shape of markers. See all here. -
xlabandylab: X and Y axis labels col: marker colormain: chart title
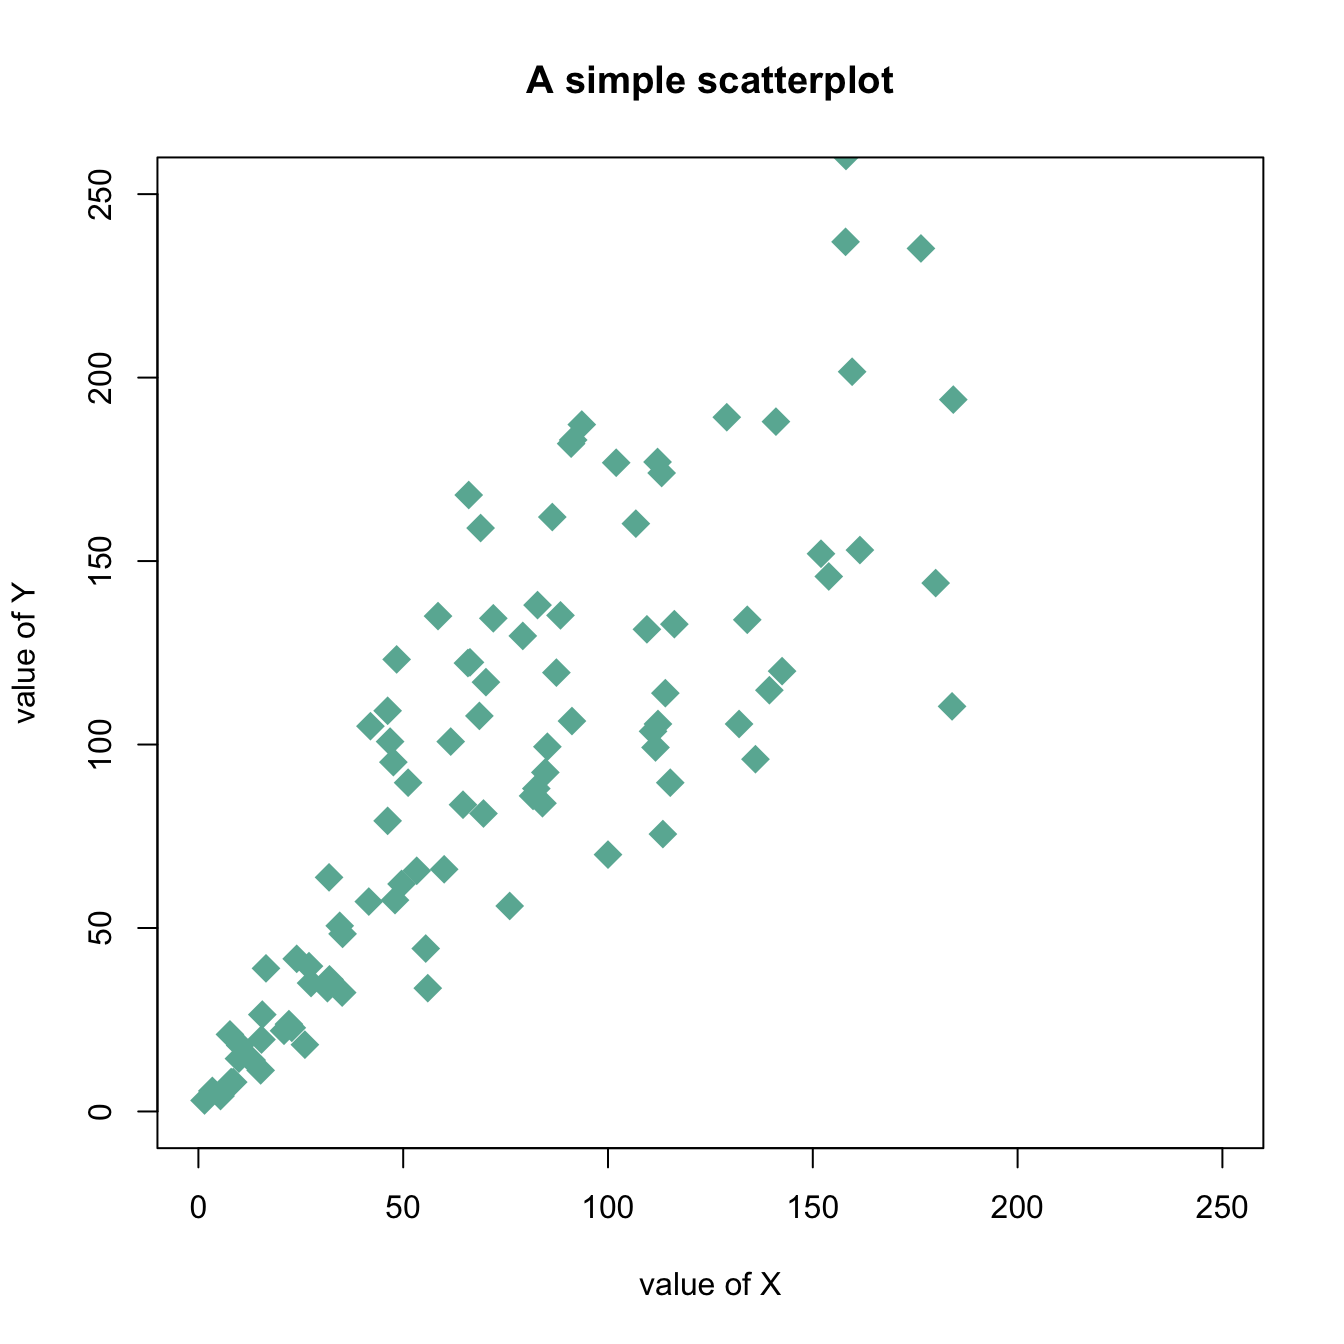
# Create data
data = data.frame(
  x=seq(1:100) + 0.1*seq(1:100)*sample(c(1:10) , 100 , replace=T),
  y=seq(1:100) + 0.2*seq(1:100)*sample(c(1:10) , 100 , replace=T)
)

# Basic scatterplot
plot(data$x, data$y,
     xlim=c(0,250) , ylim=c(0,250),
     pch=18,
     cex=2,
     col="#69b3a2",
     xlab="value of X", ylab="value of Y",
     main="A simple scatterplot"
     )


