First of all, find an image. If the image is on the web, you can
download it with download.file().
Then, load the image on R with the png library nd the
readPNG() function. Last, it is the
rasterImage() function that allows to put it on the
background.
Note: if you have a jpeg file. Use
library(jpeg) instead, and use the
readJPG() function.
# If you want to show an image coming from the web, first download it with R:
download.file("https://github.com/holtzy/R-graph-gallery/blob/master/img/logo/R_full_medium.png?raw=true" , destfile="tmp.png")
#Else, just place the image in the current directory
# Charge the image as an R object with the "JPEG" package
library(jpeg)
library(png)
my_image <- readPNG("tmp.png")
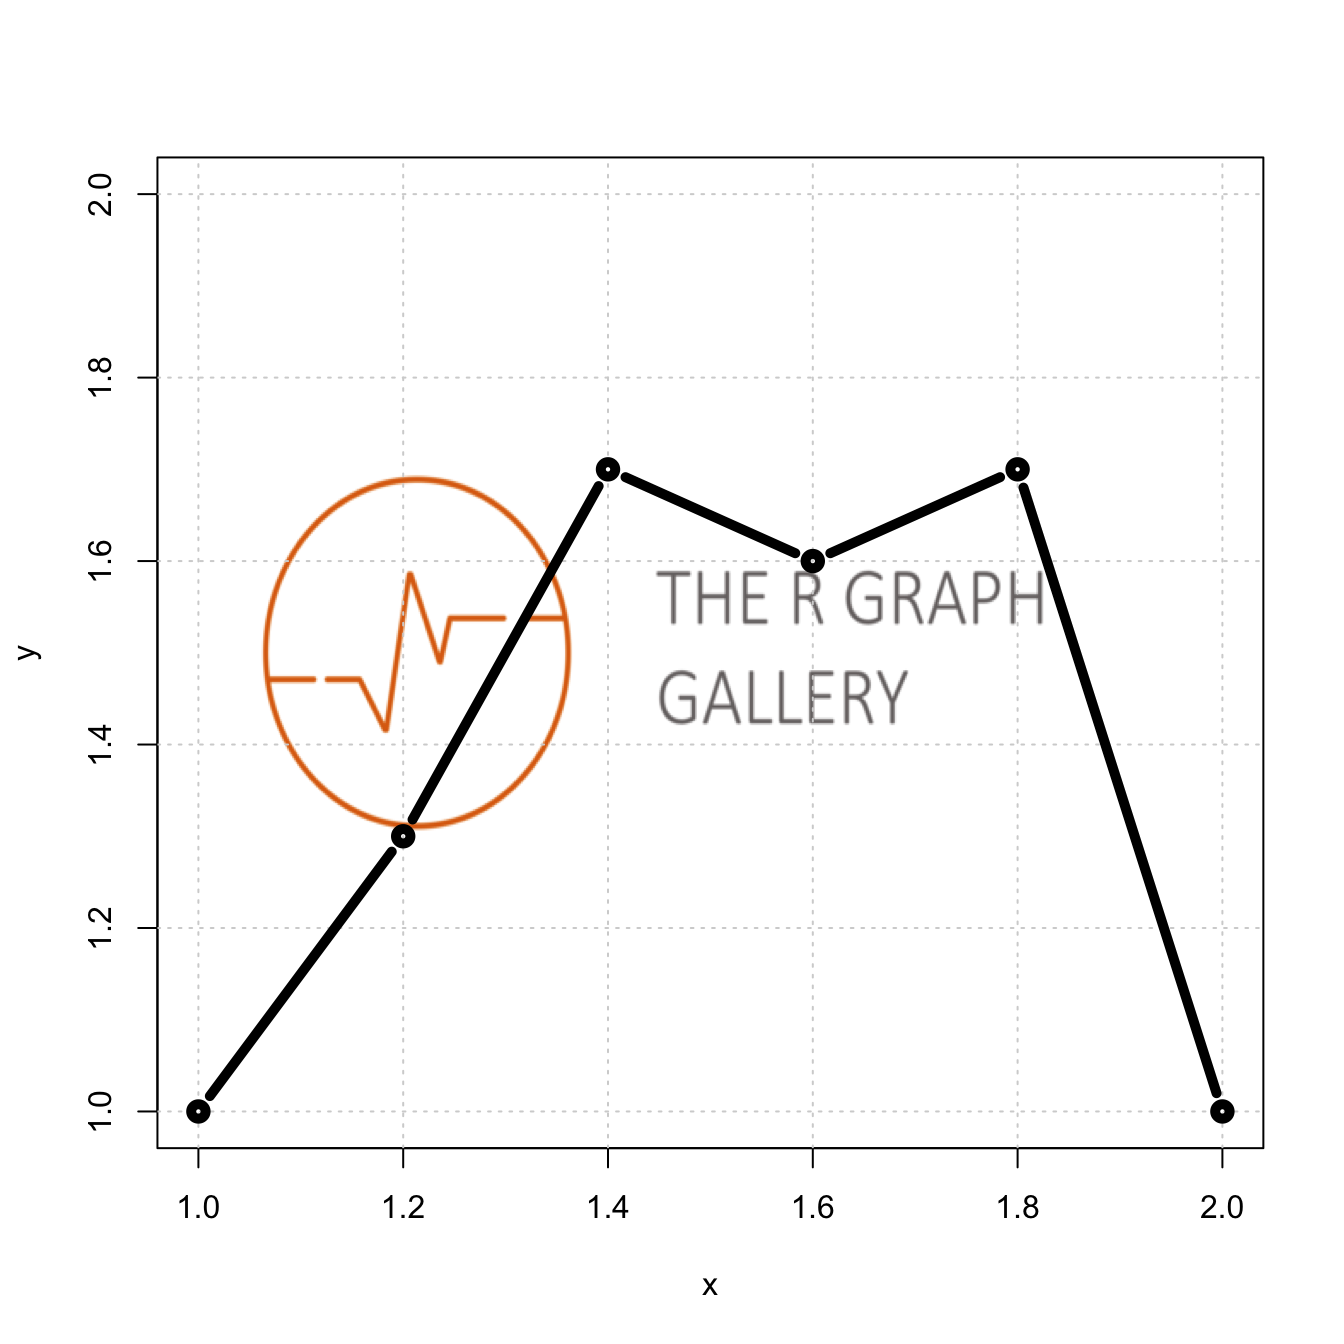
# Set up a plot area with no plot
plot(1:2, type='n', main="", xlab="x", ylab="y")
# Get the plot information so the image will fill the plot box, and draw it
lim <- par()
rasterImage(my_image,
xleft=1, xright=2,
ybottom=1.3, ytop=1.7)
grid()
#Add your plot !
lines(
x=c(1, 1.2, 1.4, 1.6, 1.8, 2.0),
y=c(1, 1.3, 1.7, 1.6, 1.7, 1.0),
type="b", lwd=5, col="black")


