Most basic barplot


This post describes how to build a basic barplot with R, without any packages, using the barplot() function.

Barchart section Barplot tips

In R, a barplot is computed using the barplot() function.

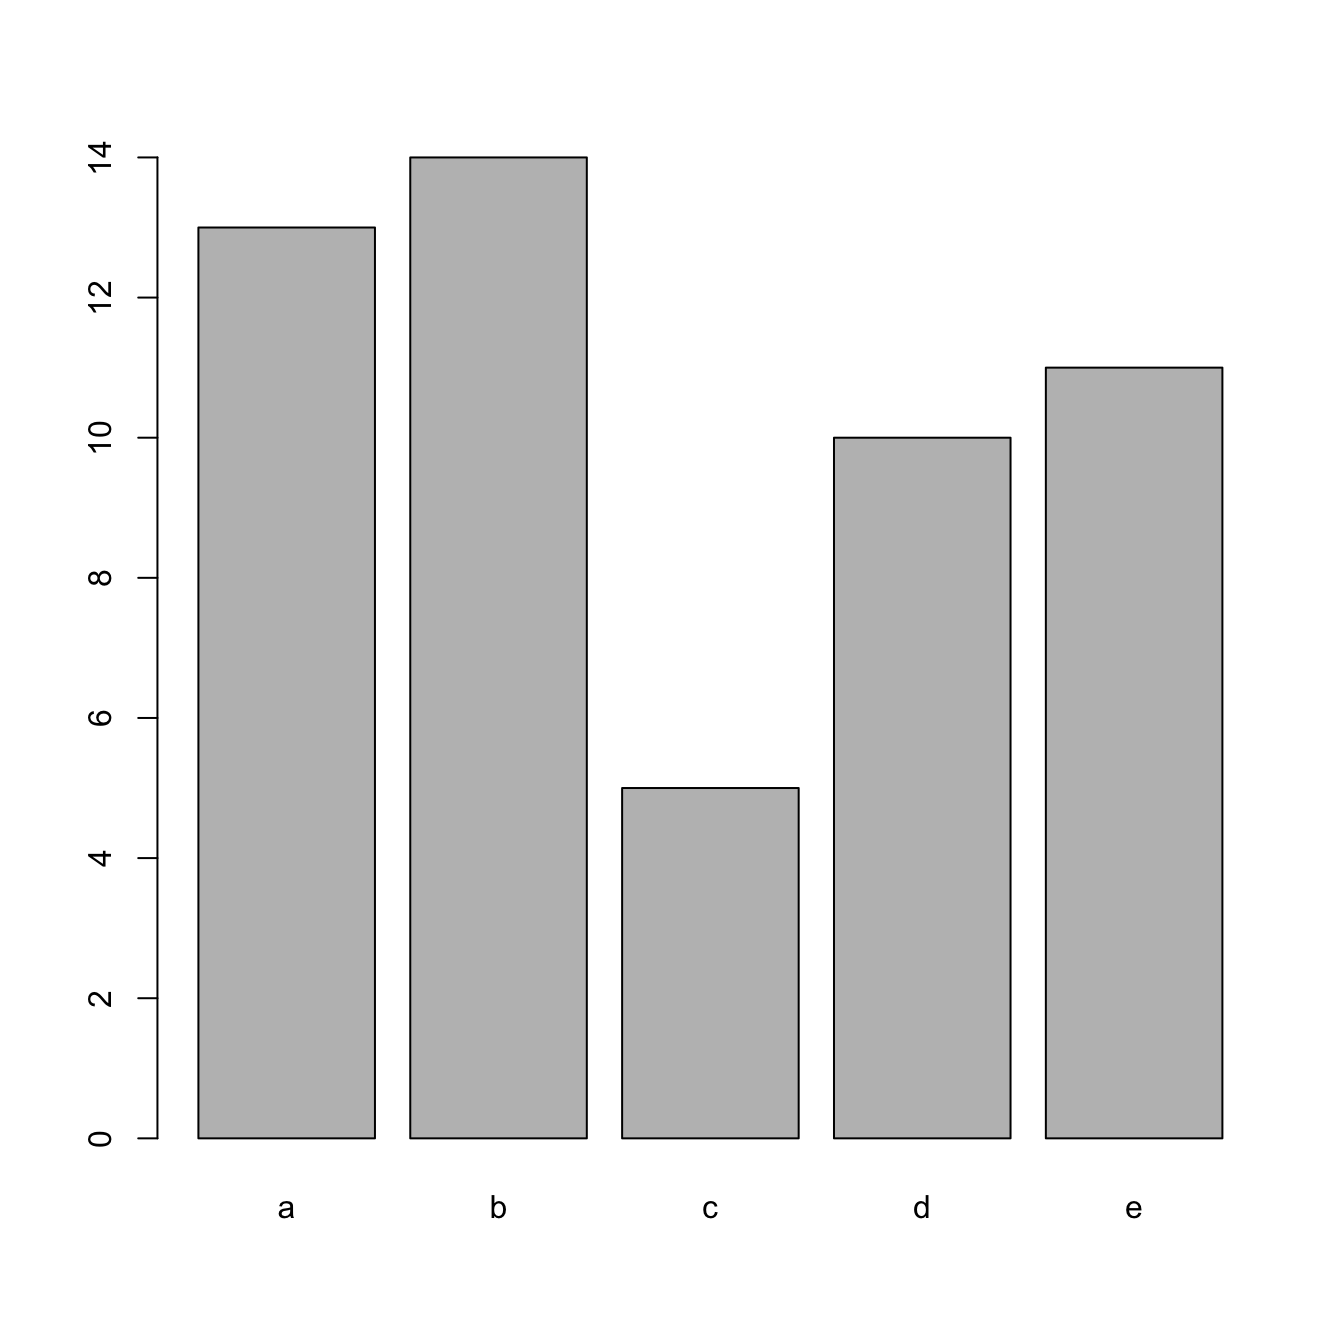
Here is the most basic example you can do. The input data is a data frame with 2 columns. value is used for bar height, name is used as category label.

Note: read more to

# create dummy data
data <- data.frame(
  name=letters[1:5],
  value=sample(seq(4,15),5)
)

# The most basic barplot you can do:
barplot(height=data$value, names=data$name)

Related chart types


Barplot
Spider / Radar
Wordcloud
Parallel
Lollipop
Circular Barplot


Contact

This document is a work by Yan Holtz. Any feedback is highly encouraged. You can fill an issue on Github, drop me a message on Twitter, or send an email pasting yan.holtz.data with gmail.com.

Github Twitter