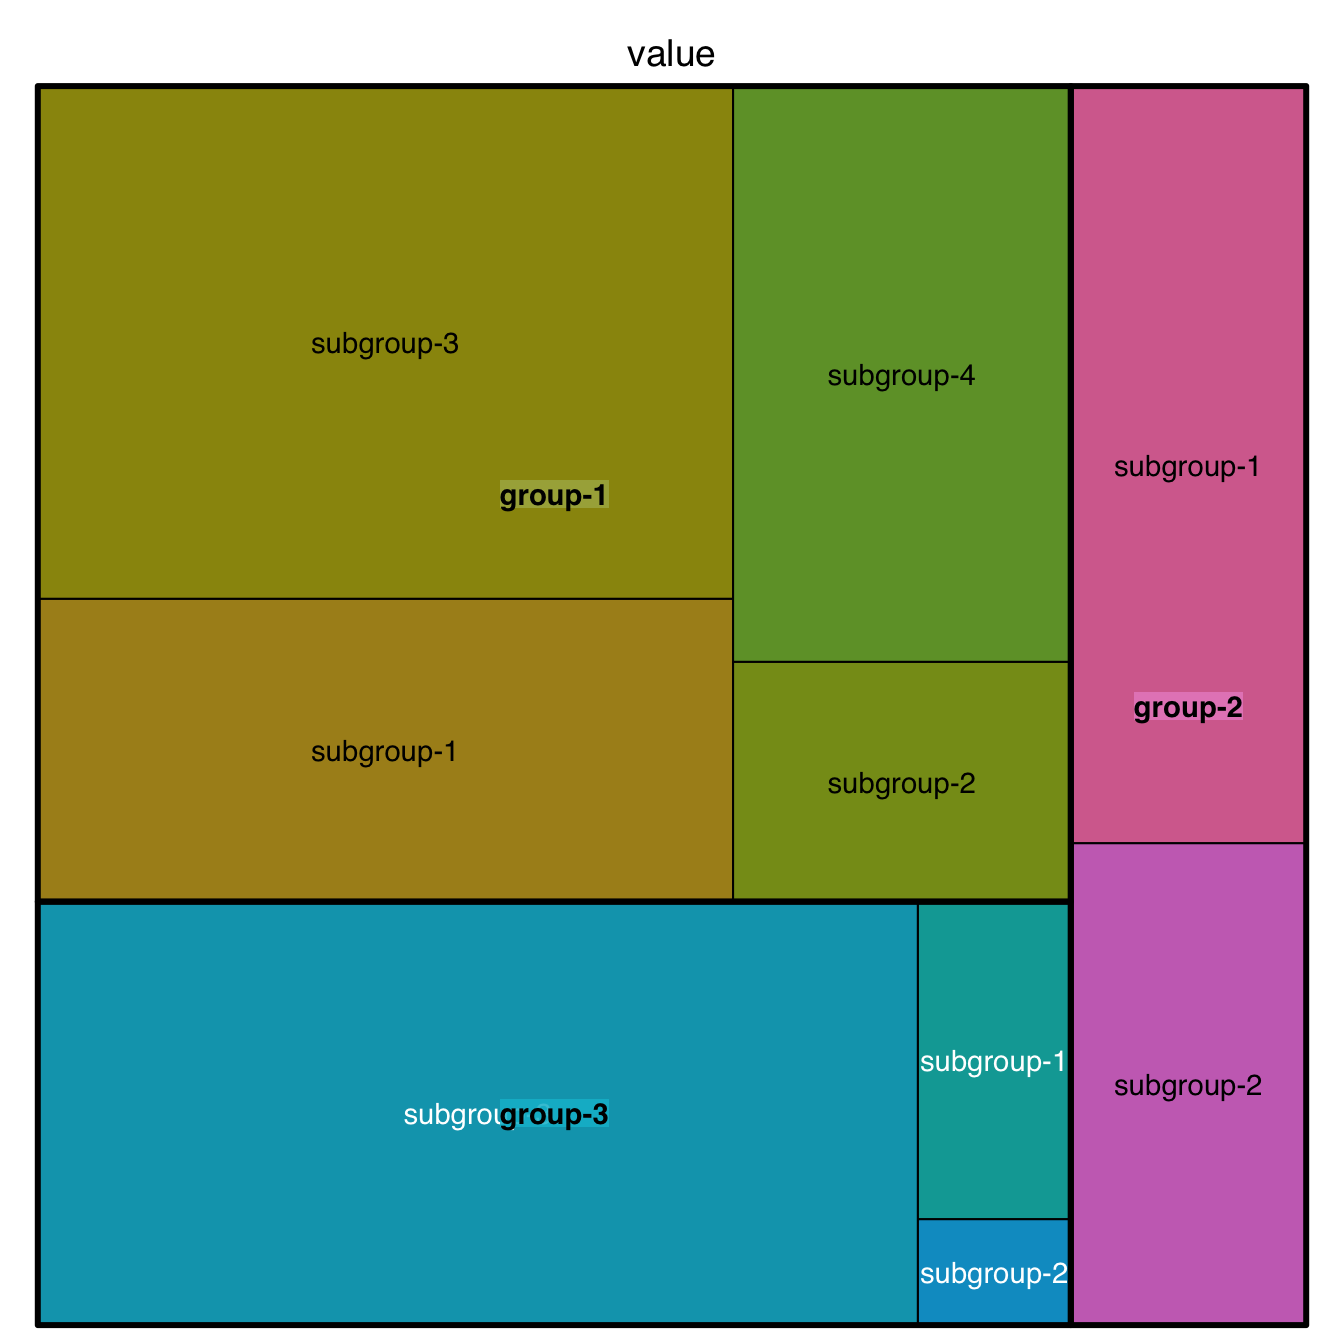
This is a treemap with several levels. We have 3 groups, each containing several subgroups. Each subgroup has a value which we map to an area.
In the index argument, you need to specify levels in
the order of importance: group > subgroup > sub-subgroup.
Note: If you have one level of grouping only, see chart #234
Note: Showing more than 2 levels often result in a cluttered and unredable figure. Why not considering an interactive version?
# library
library(treemap)

# Build Dataset
group <- c(rep("group-1",4),rep("group-2",2),rep("group-3",3))
subgroup <- paste("subgroup" , c(1,2,3,4,1,2,1,2,3), sep="-")
value <- c(13,5,22,12,11,7,3,1,23)
data <- data.frame(group,subgroup,value)

# treemap
treemap(data,
            index=c("group","subgroup"),
            vSize="value",
            type="index"
            )