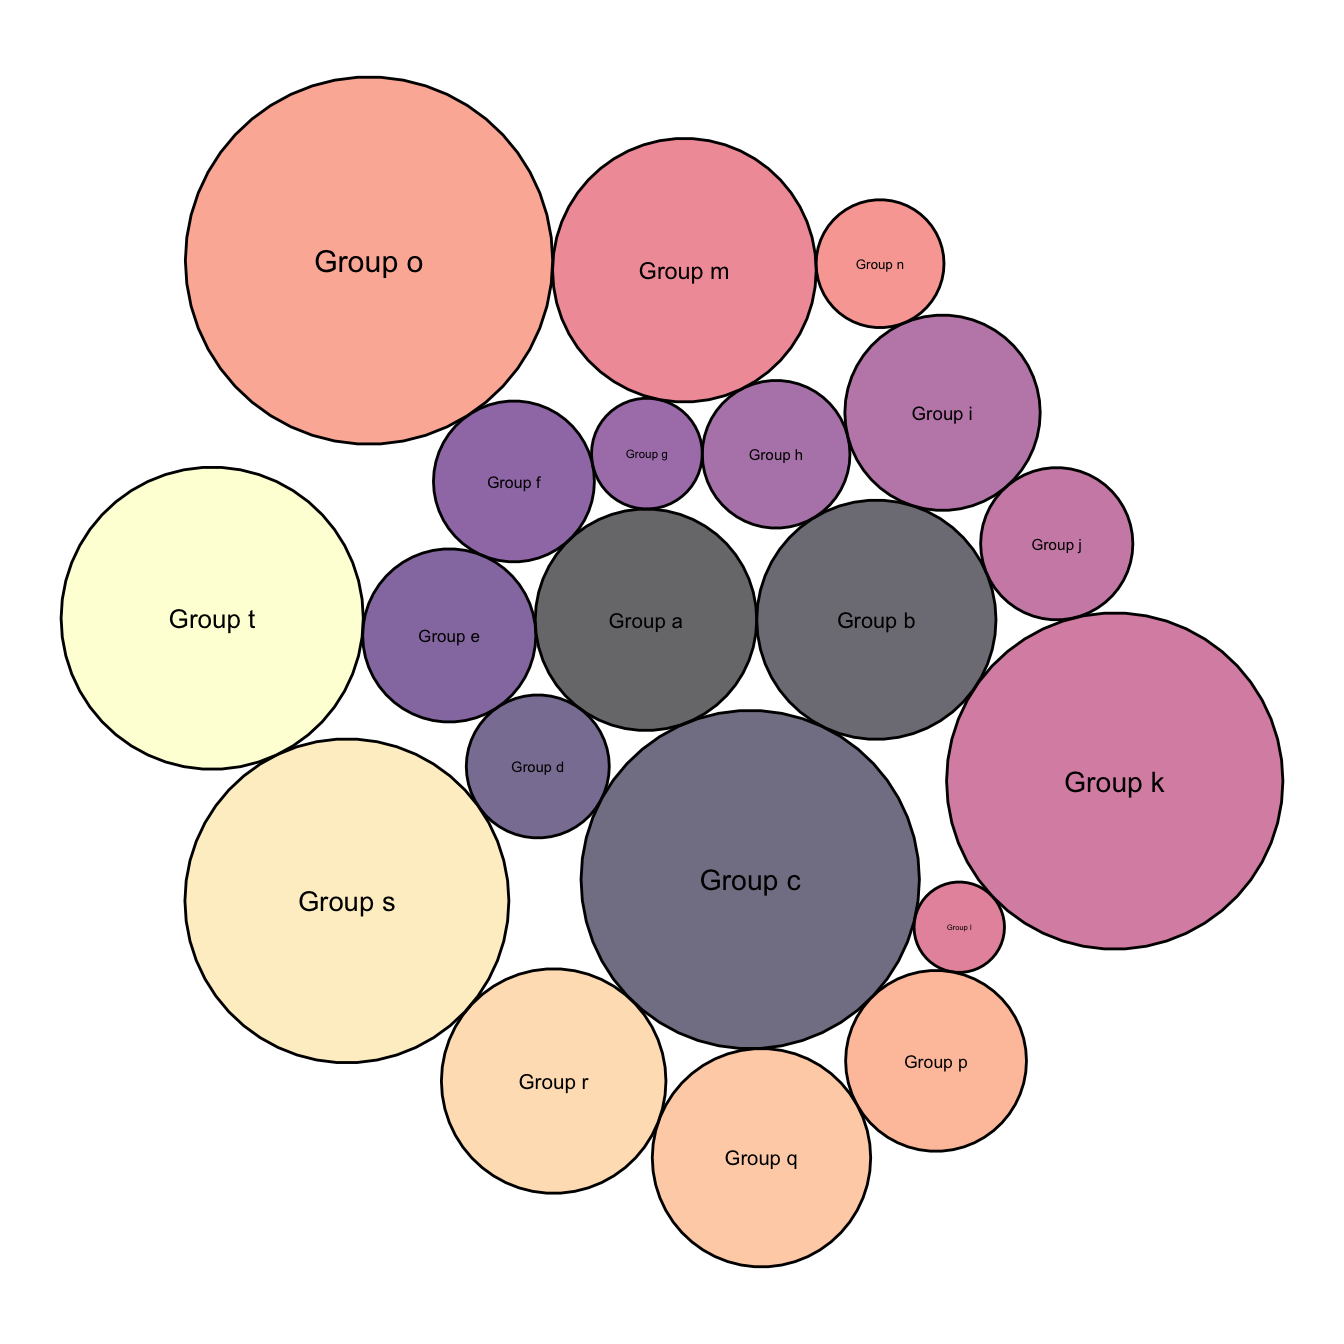
Using the viridis color scale
This chart follows the previous most basic circle packing post.
It shows how to use the awesome viridis package to
build color scales, a very good alternative to the usual
colorBrewer.
Note that magma is used here, but you could use the
same code with inferno or viridis` instead.
# libraries
library(packcircles)
library(ggplot2)
library(viridis)

# Create data
data <- data.frame(group=paste("Group", letters[1:20]), value=sample(seq(1,100),20))

# Generate the layout. sizetype can be area or radius, following your preference on what to be proportional to value.
packing <- circleProgressiveLayout(data$value, sizetype='area')
data <- cbind(data, packing)
dat.gg <- circleLayoutVertices(packing, npoints=50)

# Basic color customization
ggplot() +
  geom_polygon(data = dat.gg, aes(x, y, group = id, fill=as.factor(id)), colour = "black", alpha = 0.6) +
  scale_fill_manual(values = magma(nrow(data))) +
  geom_text(data = data, aes(x, y, size=value, label = group)) +
  scale_size_continuous(range = c(1,4)) +
  theme_void() +
  theme(legend.position="none") +
  coord_equal()
Map color to bubble value
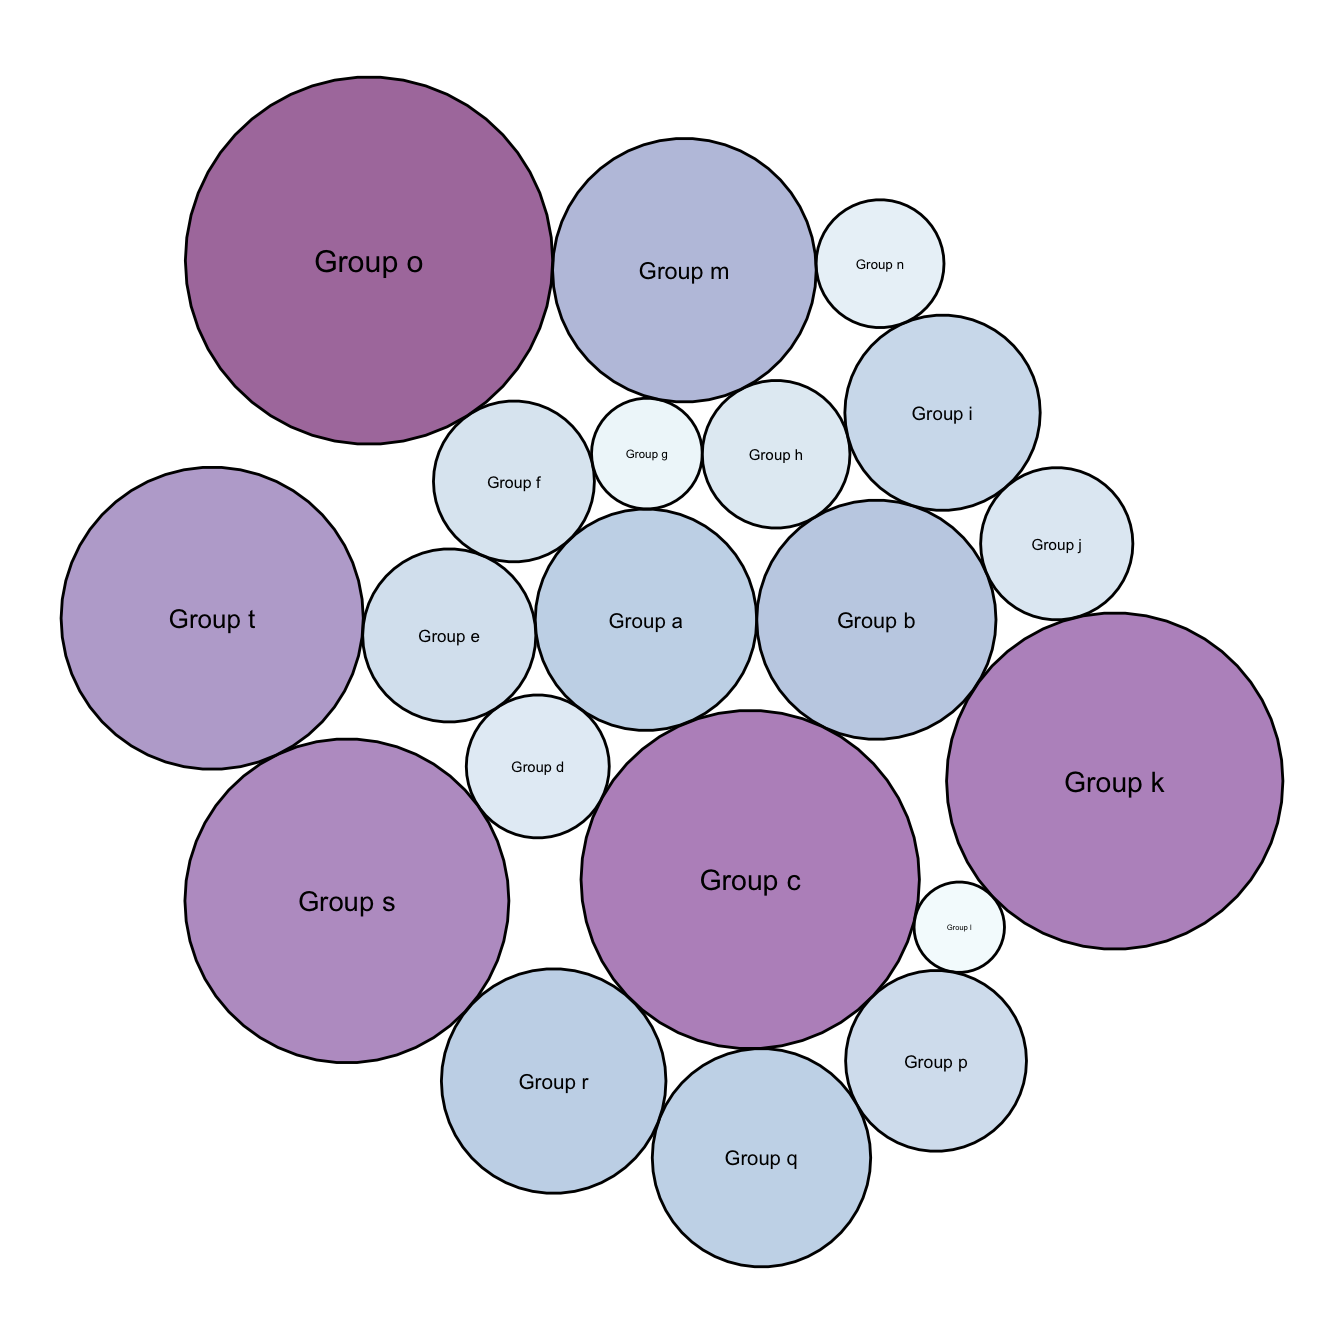
It is a common task to make the bubble color being lighter or darker according to its value.
This is possible by passing the focus variable to the dataframe that
is read by ggplot2, and specifying it in tha
aes().
# First I need to add the 'value' of each group to dat.gg.
# Here I repeat each value 51 times since I create my polygons with 50 lines
dat.gg$value <- rep(data$value, each=51)
# Plot
ggplot() +
# Make the bubbles
geom_polygon(data = dat.gg, aes(x, y, group = id, fill=value), colour = "black", alpha = 0.6) +
scale_fill_distiller(palette = "BuPu", direction = 1 ) +
# Add text in the center of each bubble + control its size
geom_text(data = data, aes(x, y, size=value, label = group)) +
scale_size_continuous(range = c(1,4)) +
# General theme:
theme_void() +
theme(legend.position="none") +
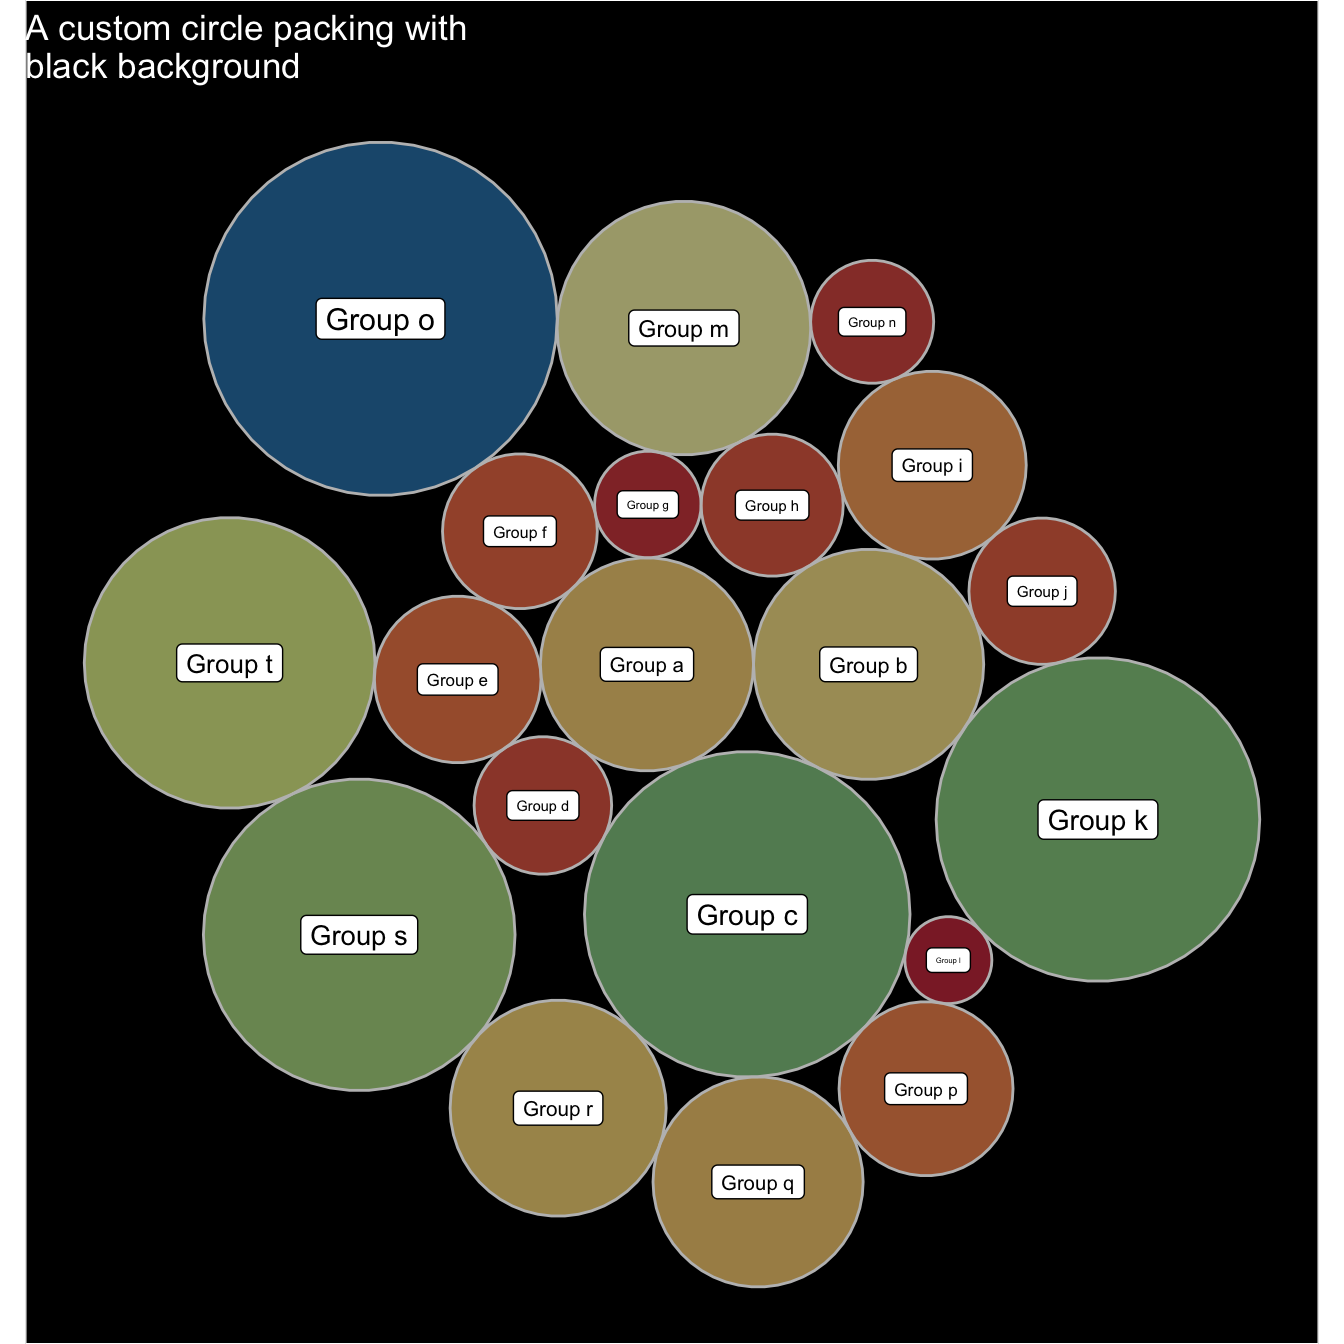
coord_equal()Background customization
Change the background thanks to the theme() function
and its plot.background() argument.
ggplot() +

  # Make the bubbles
  geom_polygon(data = dat.gg, aes(x, y, group = id, fill=value), colour = "grey", alpha = 0.6, size=.5) +
  scale_fill_distiller(palette = "Spectral", direction = 1 ) +

  # Add text in the center of each bubble + control its size
  geom_label(data = data, aes(x, y, size=value, label = group)) +
  scale_size_continuous(range = c(1,4)) +

  # General theme:
  theme_void()  +
  theme(
    legend.position="none",
    plot.background = element_rect(fill="black"),
    plot.title = element_text(color="white")
  ) +
  coord_equal() +
  ggtitle("A custom circle packing with\nblack background")


