Libraries and dataset
Install the package with
install.packages("waffle").
The input dataset is simple: we just have 3 groups, and each one has a value.
Waffle with ggplot2
The waffle package provides a
geom_waffle() function that allows to build
waffle charts with ggplot2.

Colors
You can customize the colors of the waffle chart
using the scale_fill_manual() function and the edge color
with the color argument:
ggplot(data, aes(fill=group, values=value)) +
  geom_waffle(color = "white") +
  scale_fill_manual(values = c("#999999", "#E69F00", "#56B4E9")) +
  theme_void()

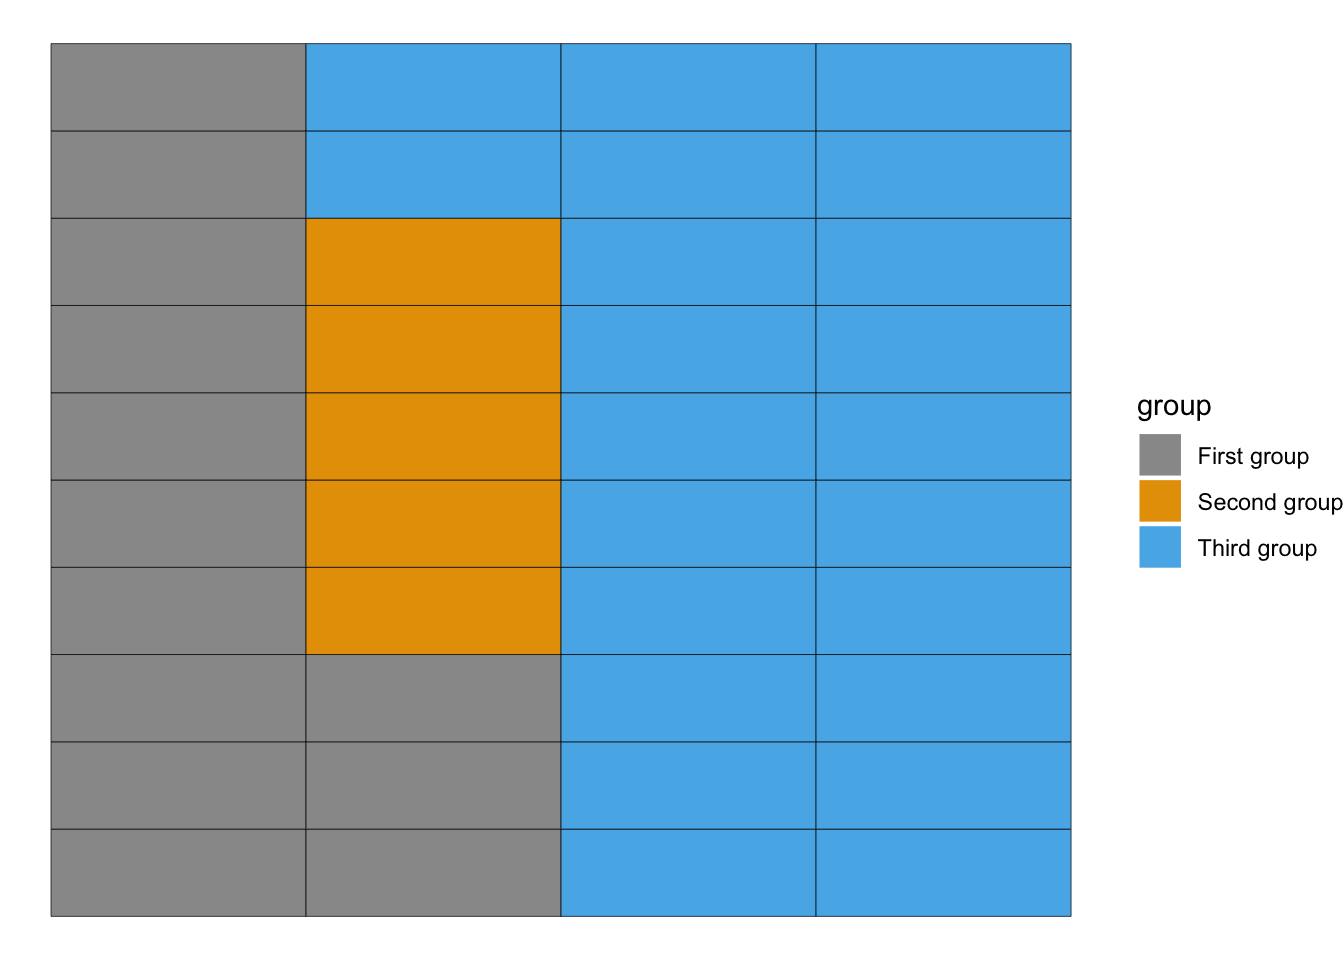
Labels
You can change labels in legend to the waffle chart:
ggplot(data, aes(fill=group, values=value)) +
  geom_waffle() +
  scale_fill_manual(
    values = c("#999999", "#E69F00", "#56B4E9"),
    labels = c("First group", "Second group", "Third group")) +
  theme_void()
Going further
You might be interested in how to create waffle chart without ggplot and how to create waffle charts with groups and subgroups.