The split_screen() function allows to divide the window
in several chart sections.
However, I personnaly believe that
- the mfrow method is more adapted for simple layouts
- the layout function is better for complex layouts.
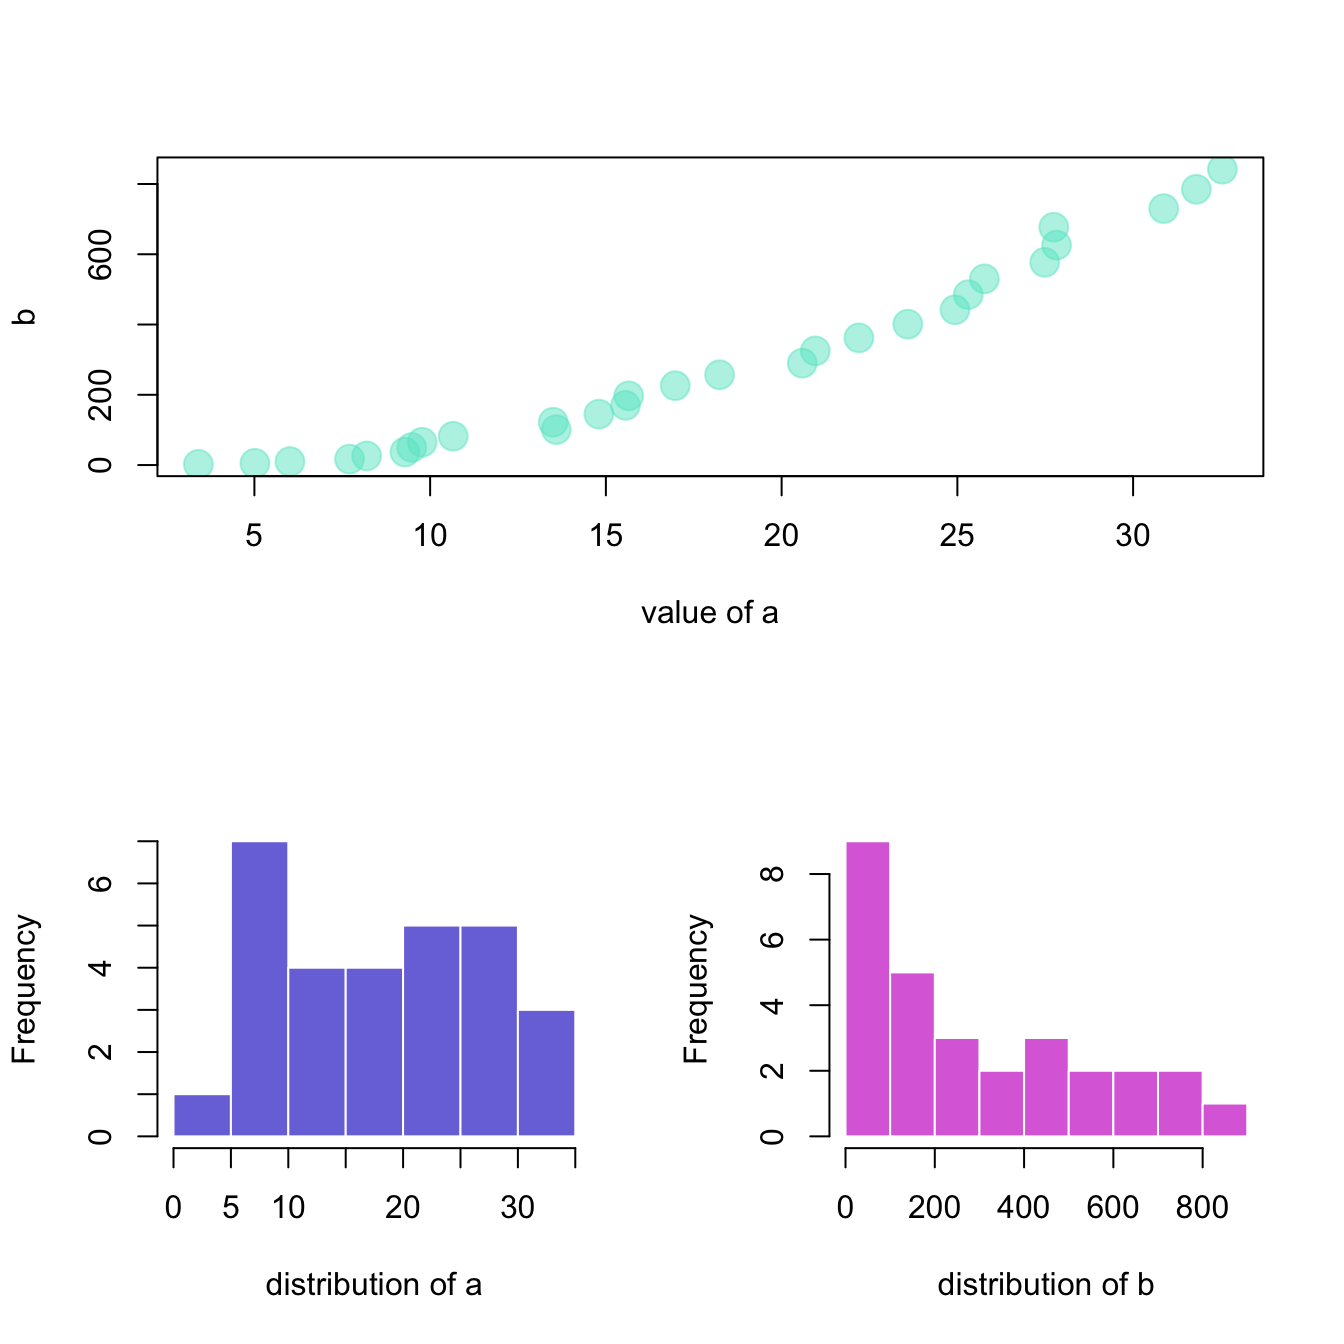
#Create data
a <- seq(1,29)+4*runif(29,0.4)
b <- seq(1,29)^2+runif(29,0.98)

# I divide the screen in 2 line and 1 column only
my_screen_step1 <- split.screen(c(2, 1))

# I add one graph on the screen number 1 which is on top :
screen(my_screen_step1[1])
plot( a,b , pch=20 , xlab="value of a" , cex=3 , col=rgb(0.4,0.9,0.8,0.5) )


# I divide the second screen in 2 columns :
my_screen_step2 <- split.screen(c(1, 2), screen = my_screen_step1[2])
screen(my_screen_step2[1])
hist(a, border=F , col=rgb(0.2,0.2,0.8,0.7) , main="" , xlab="distribution of a")
screen(my_screen_step2[2])
hist(b, border=F , col=rgb(0.8,0.2,0.8,0.7) , main="" ,  xlab="distribution of b")


