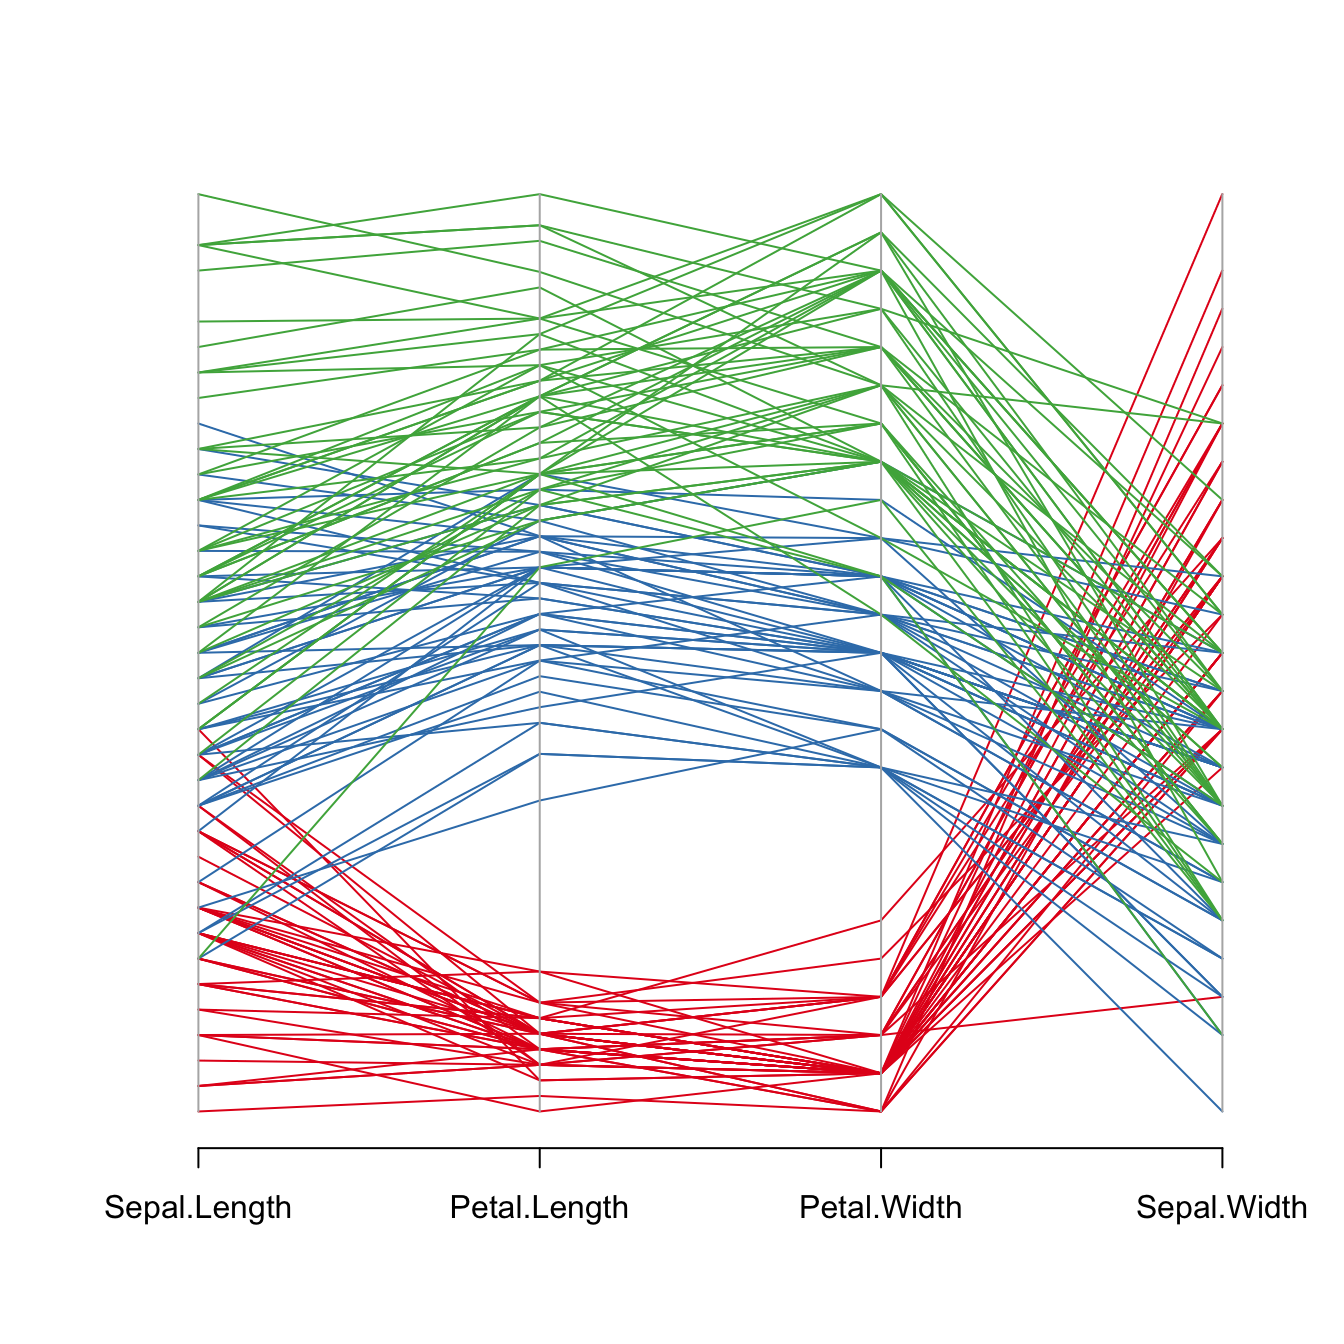
The parcoord() function of the MASS library.
The MASS library provides the
parcoord() function that automatically builds parallel
coordinates chart.
The input dataset must be a data frame composed by numeric variables only. Each variable will be used to build one vertical axis of the chart.
# You need the MASS library
library(MASS)

# Vector color
my_colors <- colors()[as.numeric(iris$Species)*11]

# Make the graph !
parcoord(iris[,c(1:4)] , col= my_colors  )
Reorder variables
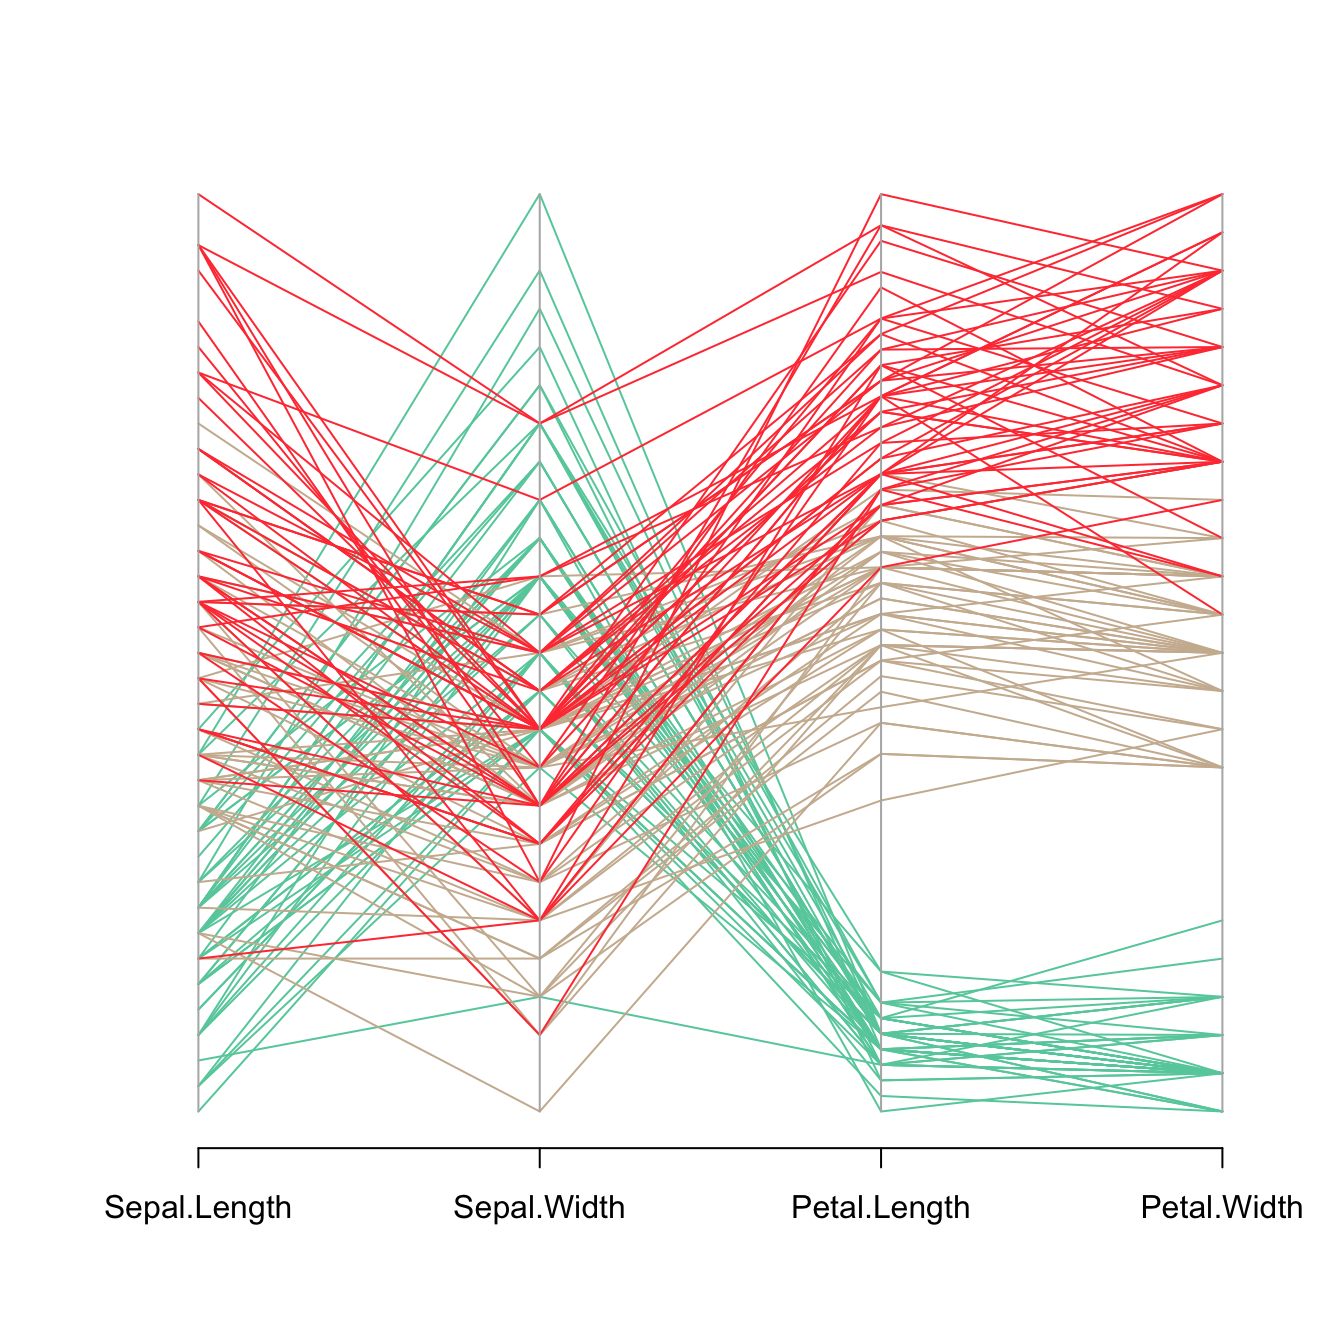
It is important to find the best variable order in your parallel coordinates chart. To change it, just change the order in the input dataset.
Note: the RColorBrewer package is used to
generate a nice and reliable color palette.
# You need the MASS library
library(MASS)
# Vector color
library(RColorBrewer)
palette <- brewer.pal(3, "Set1")
my_colors <- palette[as.numeric(iris$Species)]
# Make the graph !
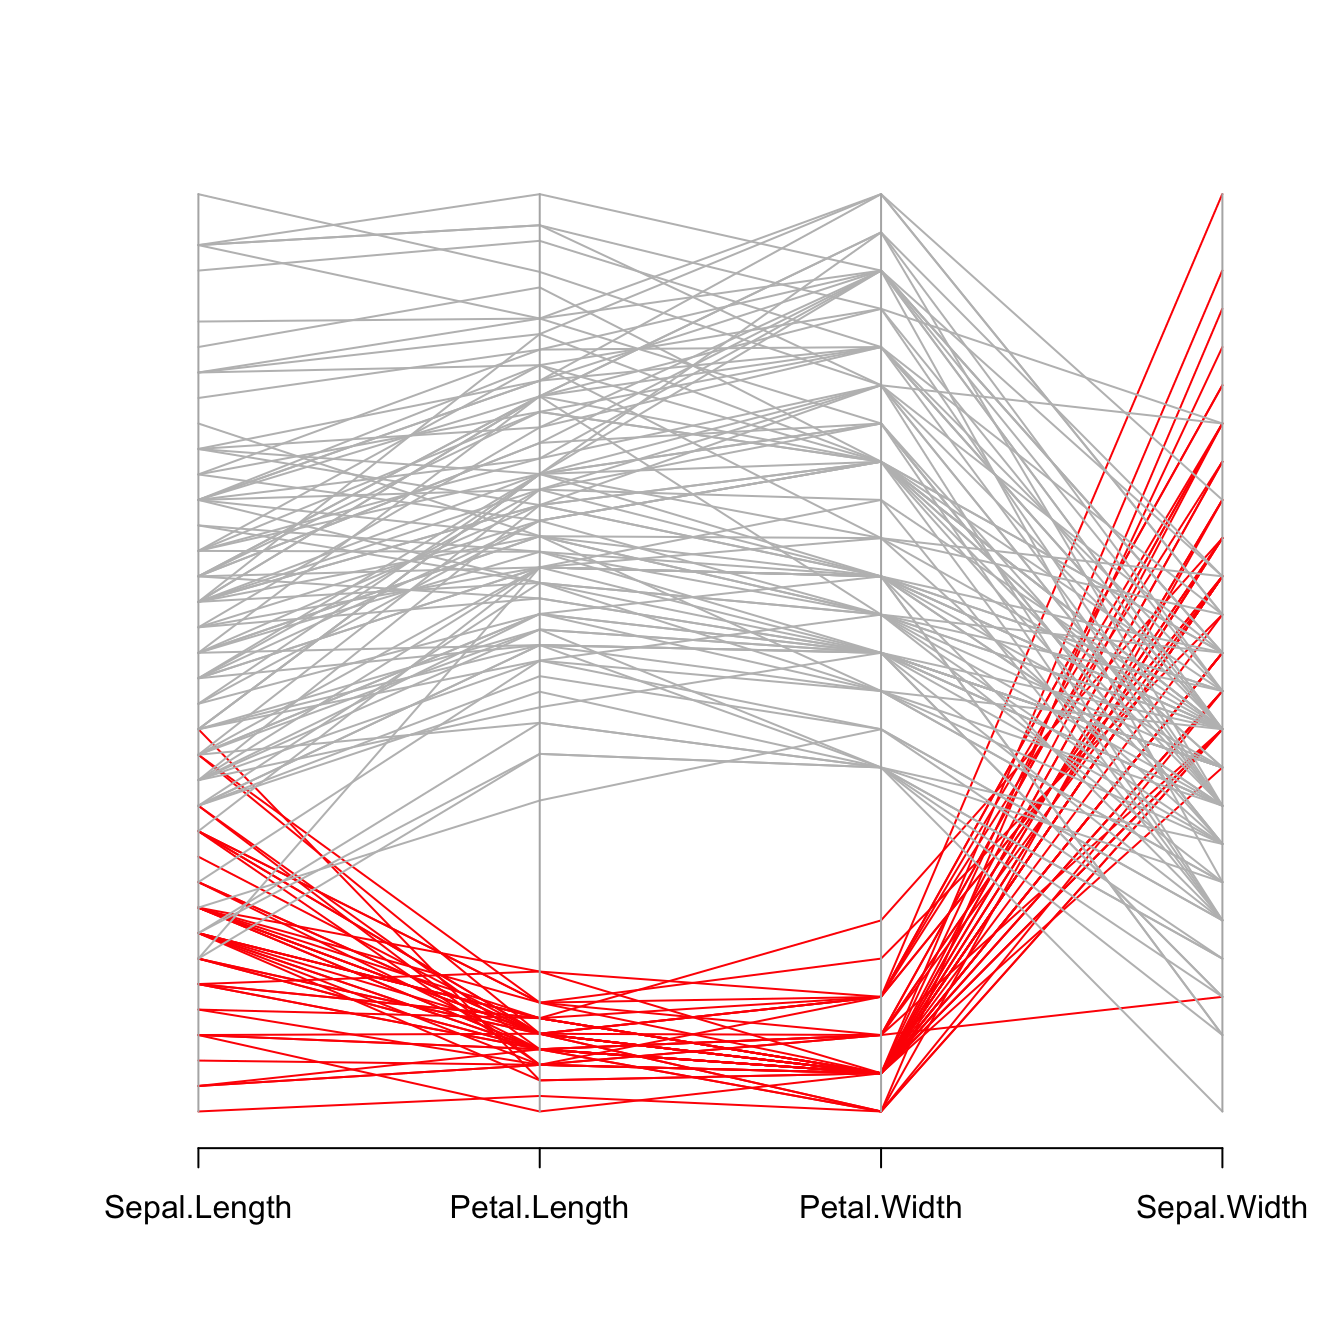
parcoord(iris[,c(1,3,4,2)] , col= my_colors )Highlight a group
Data visualization aims to highlight a story in the data. If you are interested in a specific group, you can highlight it as follow: