About
This page showcases the work of Cedric Scherer, built for the TidyTuesday initiative. You can find the original code on his github repository here.
Thanks to him for accepting sharing his work here! 🙏🙏 Thanks also to Tomás Capretto who help writing down the blogpost!
As a teaser, here is the plot we’re gonna try building:
Package and Theme
Let’s start by loading the packages needed to build the figure. From all
the packages we use,
ragg may be the least
known. It’s a great library that impacts both the quality and
performance of our graphs in R thanks to the new graphic
devices it brings through the lower-level
AGG library.
# Load packages
library(tidyverse)
library(ggtext)
library(ragg)

# Set ggplot theme
theme_set(theme_minimal(base_family = "Atlantis", base_size = 13))
theme_update(
  plot.margin = margin(25, 15, 15, 25),
  plot.background = element_rect(color = "#FFFCFC", fill = "#FFFCFC"),
  panel.grid.major.x = element_line(color = "grey94"),
  panel.grid.major.y = element_blank(),
  panel.grid.minor = element_blank(),
  axis.text = element_text(family = "Hydrophilia Iced"),
  axis.text.x = element_text(color = "grey40"),
  axis.text.y = element_blank(),
  axis.title = element_blank(),
  axis.ticks = element_blank(),
  legend.position = c(.07, .31),
  legend.title = element_text(
    color = "grey40",
    family = "Overpass",
    angle = 90,
    hjust = .5
  ),
  legend.text = element_text(
    color = "grey40",
    family = "Hydrophilia Iced",
    size = 12
  ),
  legend.box = "horizontal",
  legend.box.just = "bottom",
  legend.margin = margin(0, 0, 0, 0),
  legend.spacing = unit(.6, "lines"),
  plot.title = element_text(
    family = "Atlantis Headline",
    face = "bold",
    size = 17.45
  ),
  plot.subtitle = element_textbox_simple(
    family = "Overpass",
    color = "grey40",
    size = 10.8,
    lineheight = 1.3,
    margin = margin(t = 5, b = 30)
  ),
  plot.caption = element_text(
    family = "Overpass",
    color = "grey55",
    size = 10.5,
    margin = margin(t = 20, b = 0, r = 15)
  )
)
Load and prepare the dataset
The dataset provides world records for the Mario Kart 64 game. The game consists of 16 individual tracks and world records can be achieved for the fastest single lap or the fastest completed race (three laps). Also, through the years, players discovered shortcuts in many of the tracks. Fortunately, shortcut and non-shortcut world records are listed separately.
Our chart consists of a double-dumbbell plot, a variation of the better known lollipop chart, where we visualize world record times on Mario Kart 64 with and without shortcuts. The original source of the data is available here. It holds time trial world records for all of the Mario Kart games, but we are using the version released for the TidyTuesday initiative on the week of 2021-05-25. You can find the original announcement and more information about the data here.
From all the columns in the data, we only use track,
type, shortcut, date, and
time.
trackindicates the name of the track-
typetells us whether the record is for single lap or a complete race -
shortcutis a yes/no variable that identifies records where a shortcut was used -
daterepresents the date where the record was achieved -
timeindicates how many seconds it took to complete the track.
On this occasion, we only keep records for complete races. We start by
creating df_rank, a data frame that keeps current world
records for every track. The two last arrange() and
mutate() lines are used to convert track into
an ordered factor where the order is given by the time it took to
complete the race. It will be useful when sorting tracks on the plot.
df_rank <-
  df_records %>%
  filter(type == "Three Lap") %>%
  group_by(track) %>%
  filter(time == min(time)) %>%
  ungroup %>%
  arrange(-time) %>%
  mutate(track = fct_inorder(track, time))
We also create df_records_three which holds all the
records, no matter they were beaten or not. It is used to derive other
data frames that are used in our chart.
df_records_three <-
  df_records %>%
  filter(type == "Three Lap") %>%
  mutate(year = lubridate::year(date)) %>%
  mutate(track = factor(track, levels = levels(df_rank$track)))
The first data frame derived is df_connect. This one is
used to add a dotted line that connects record times with and without
shortcuts.
df_connect <-
  df_records_three %>%
  group_by(track, type, shortcut) %>%
  summarize(no = min(time), yes = max(time)) %>%
  pivot_longer(
    cols = -c(track, type, shortcut),
    names_to = "record",
    values_to = "time"
  ) %>%
  # The line goes from the first record without shortcut (the slower)
  # to the most recent record with shortcut (the fastest)
  filter((shortcut == "No" & record == "no") | (shortcut == "Yes" & record == "yes")) %>%
  pivot_wider(id_cols = c(track), values_from = time, names_from = record)
Then we have df_longdist and df_shortcut.
Without getting much into the details, we note each data frame consists
of five columns: track, year,
max, min and diff.
year refers to the year where the current record was
achieved, max is the completetion time for the first record
and min is the time for the current record.
diff is simply the difference between max and
min, i.e. a measurement of how much the first record was
improved. df_shortcut and df_longdist refer to
records with and without shortcuts, respectively.
df_longdist <-
  df_records_three %>%
  filter(shortcut == "No") %>%
  group_by(track) %>%
  filter(time == min(time) | time == max(time)) %>%
  mutate(group = if_else(time == min(time), "min", "max")) %>%
  group_by(track, group) %>%
  arrange(time) %>%
  slice(1) %>%
  group_by(track) %>%
  mutate(year = max(year)) %>%
  pivot_wider(id_cols = c(track, year), values_from = time, names_from = group) %>%
  mutate(diff = max - min)

df_shortcut <-
  df_records_three %>%
  filter(shortcut == "Yes") %>%
  group_by(track) %>%
  filter(time == min(time) | time == max(time)) %>%
  mutate(group = if_else(time == min(time), "min", "max")) %>%
  group_by(track, group) %>%
  arrange(time) %>%
  slice(1) %>%
  group_by(track) %>%
  mutate(year = max(year)) %>%
  pivot_wider(id_cols = c(track, year), values_from = time, names_from = group) %>%
  mutate(diff = max - min)
Basic Plot
In this case, our lollipop plot consists of several overlapped geoms. As always there’s intentional overlap in a plot, we add what we want to remain on the background first.
# This dataset `df_shorcut` and the aesthetics `aes(min, track)` are used
# in the `geom_*` calls when they are not explicitly specified.
p <- df_shortcut %>%
  ggplot(aes(min, track)) +
  # Dotted line connection shortcut yes/no
  # This geom uses `df_connect` instead of `df_shorcut` because it is being
  # explicitly overridden
  geom_linerange(
    data = df_connect,
    aes(xmin = yes, xmax = no, y = track),
    inherit.aes = FALSE,
    color = "grey75",
    linetype = "11" # dotted line
  ) +
  # Segment when shortcut==yes
  # When the `data` argument is missing in the `geom_*` function
  geom_linerange(aes(xmin = min, xmax = max, color = diff), size = 2) +
  # Segment when shortcut==no. Overlapped lineranges.
  geom_linerange(data = df_longdist, aes(xmin = min, xmax = max, color = diff), size = 2) +
  geom_linerange(data = df_longdist, aes(xmin = min, xmax = max), color = "#FFFCFC", size = .8)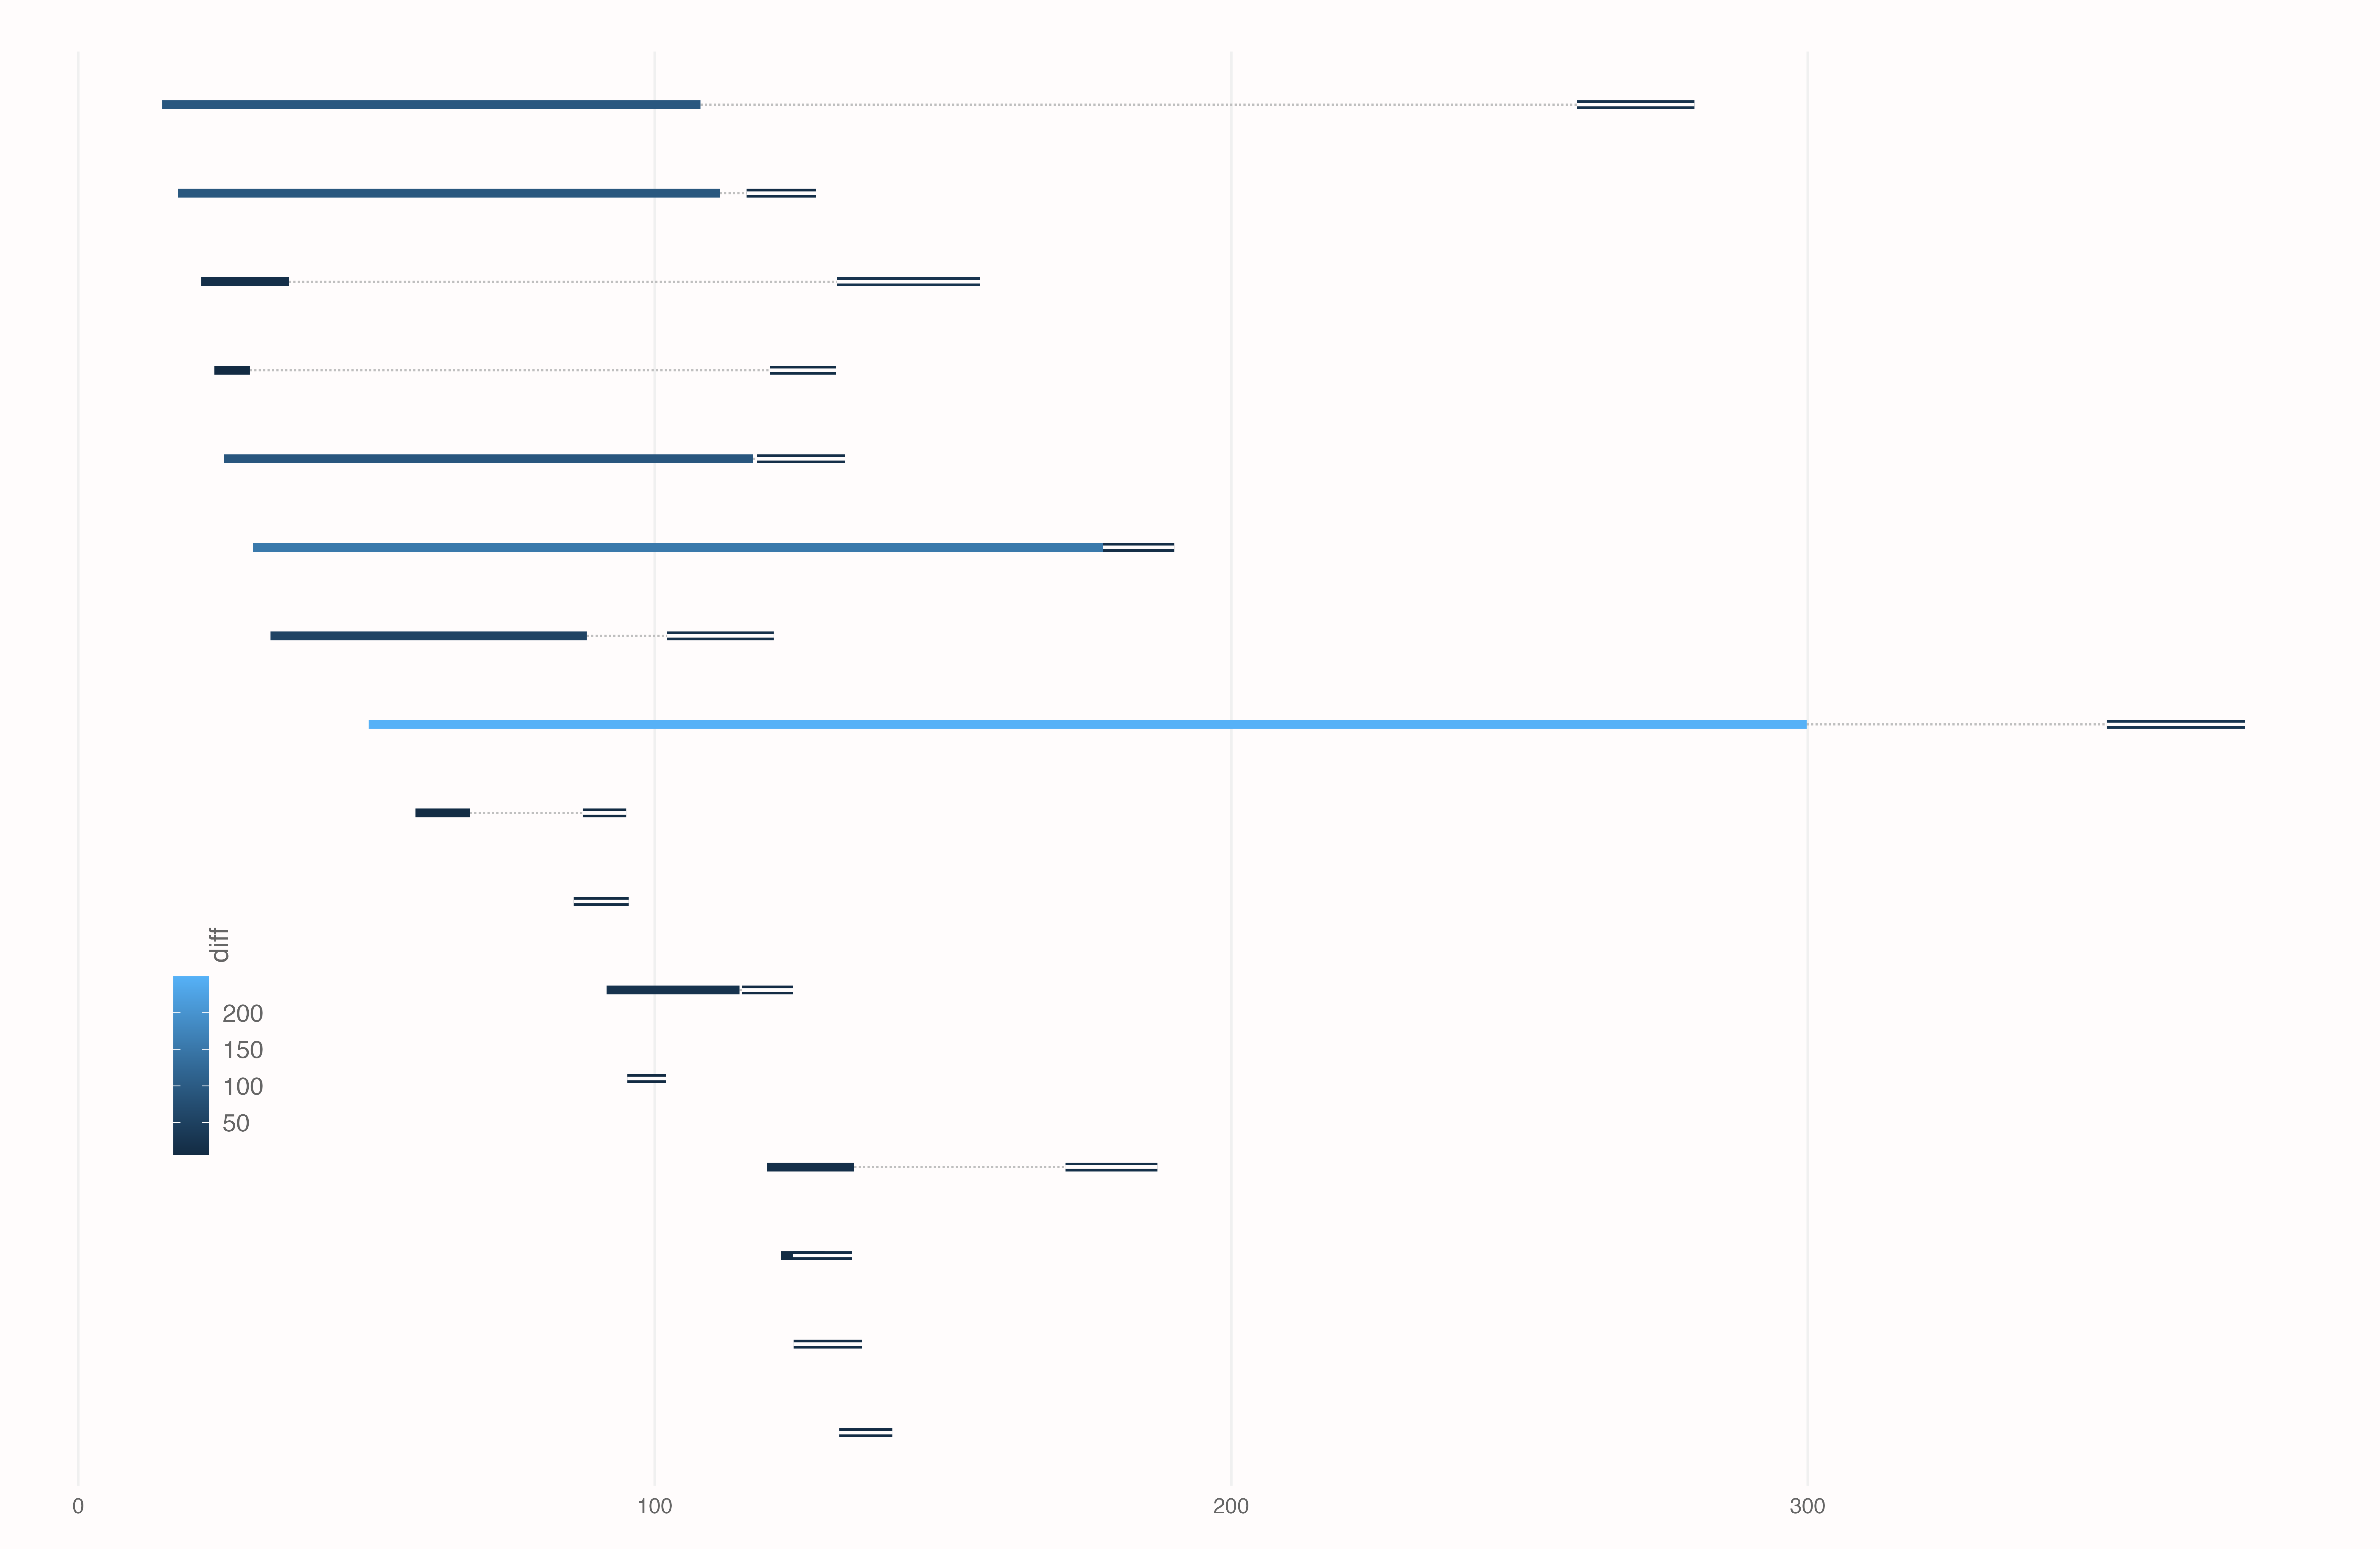
While there’s a lot we still have to customize yet, this preview lets us see that the white center in the lines is used to differentiate records without shortcuts from those records with shortcuts.
Customized lollipop Plot
The same logic is used in the next chunk to add dots representing the first and last world records for each modality.
p <- p +
  # Point when shortcut==yes – first record
  geom_point(aes(x = max), size = 7, color = "#FFFCFC", fill = "grey65", shape = 21, stroke = .7) +
  # Point when shortcut==yes – latest record.
  geom_point(aes(fill = year), size = 7, color = "#FFFCFC", shape = 21, stroke = .7) +
  # Point when shortcut==no – first record.
  geom_point(data = df_longdist, aes(fill = year), size = 5.6, shape = 21,
             color = "#FFFCFC", stroke = .5) +
  geom_point(data = df_longdist, size = 3, color = "#FFFCFC") +
  # Point when shortcut==no – latest record
  geom_point(data = df_longdist, aes(x = max), size = 5.6, shape = 21,
             fill = "grey65", color = "#FFFCFC", stroke = .5) +
  geom_point(data = df_longdist, aes(x = max), size = 3, color = "#FFFCFC")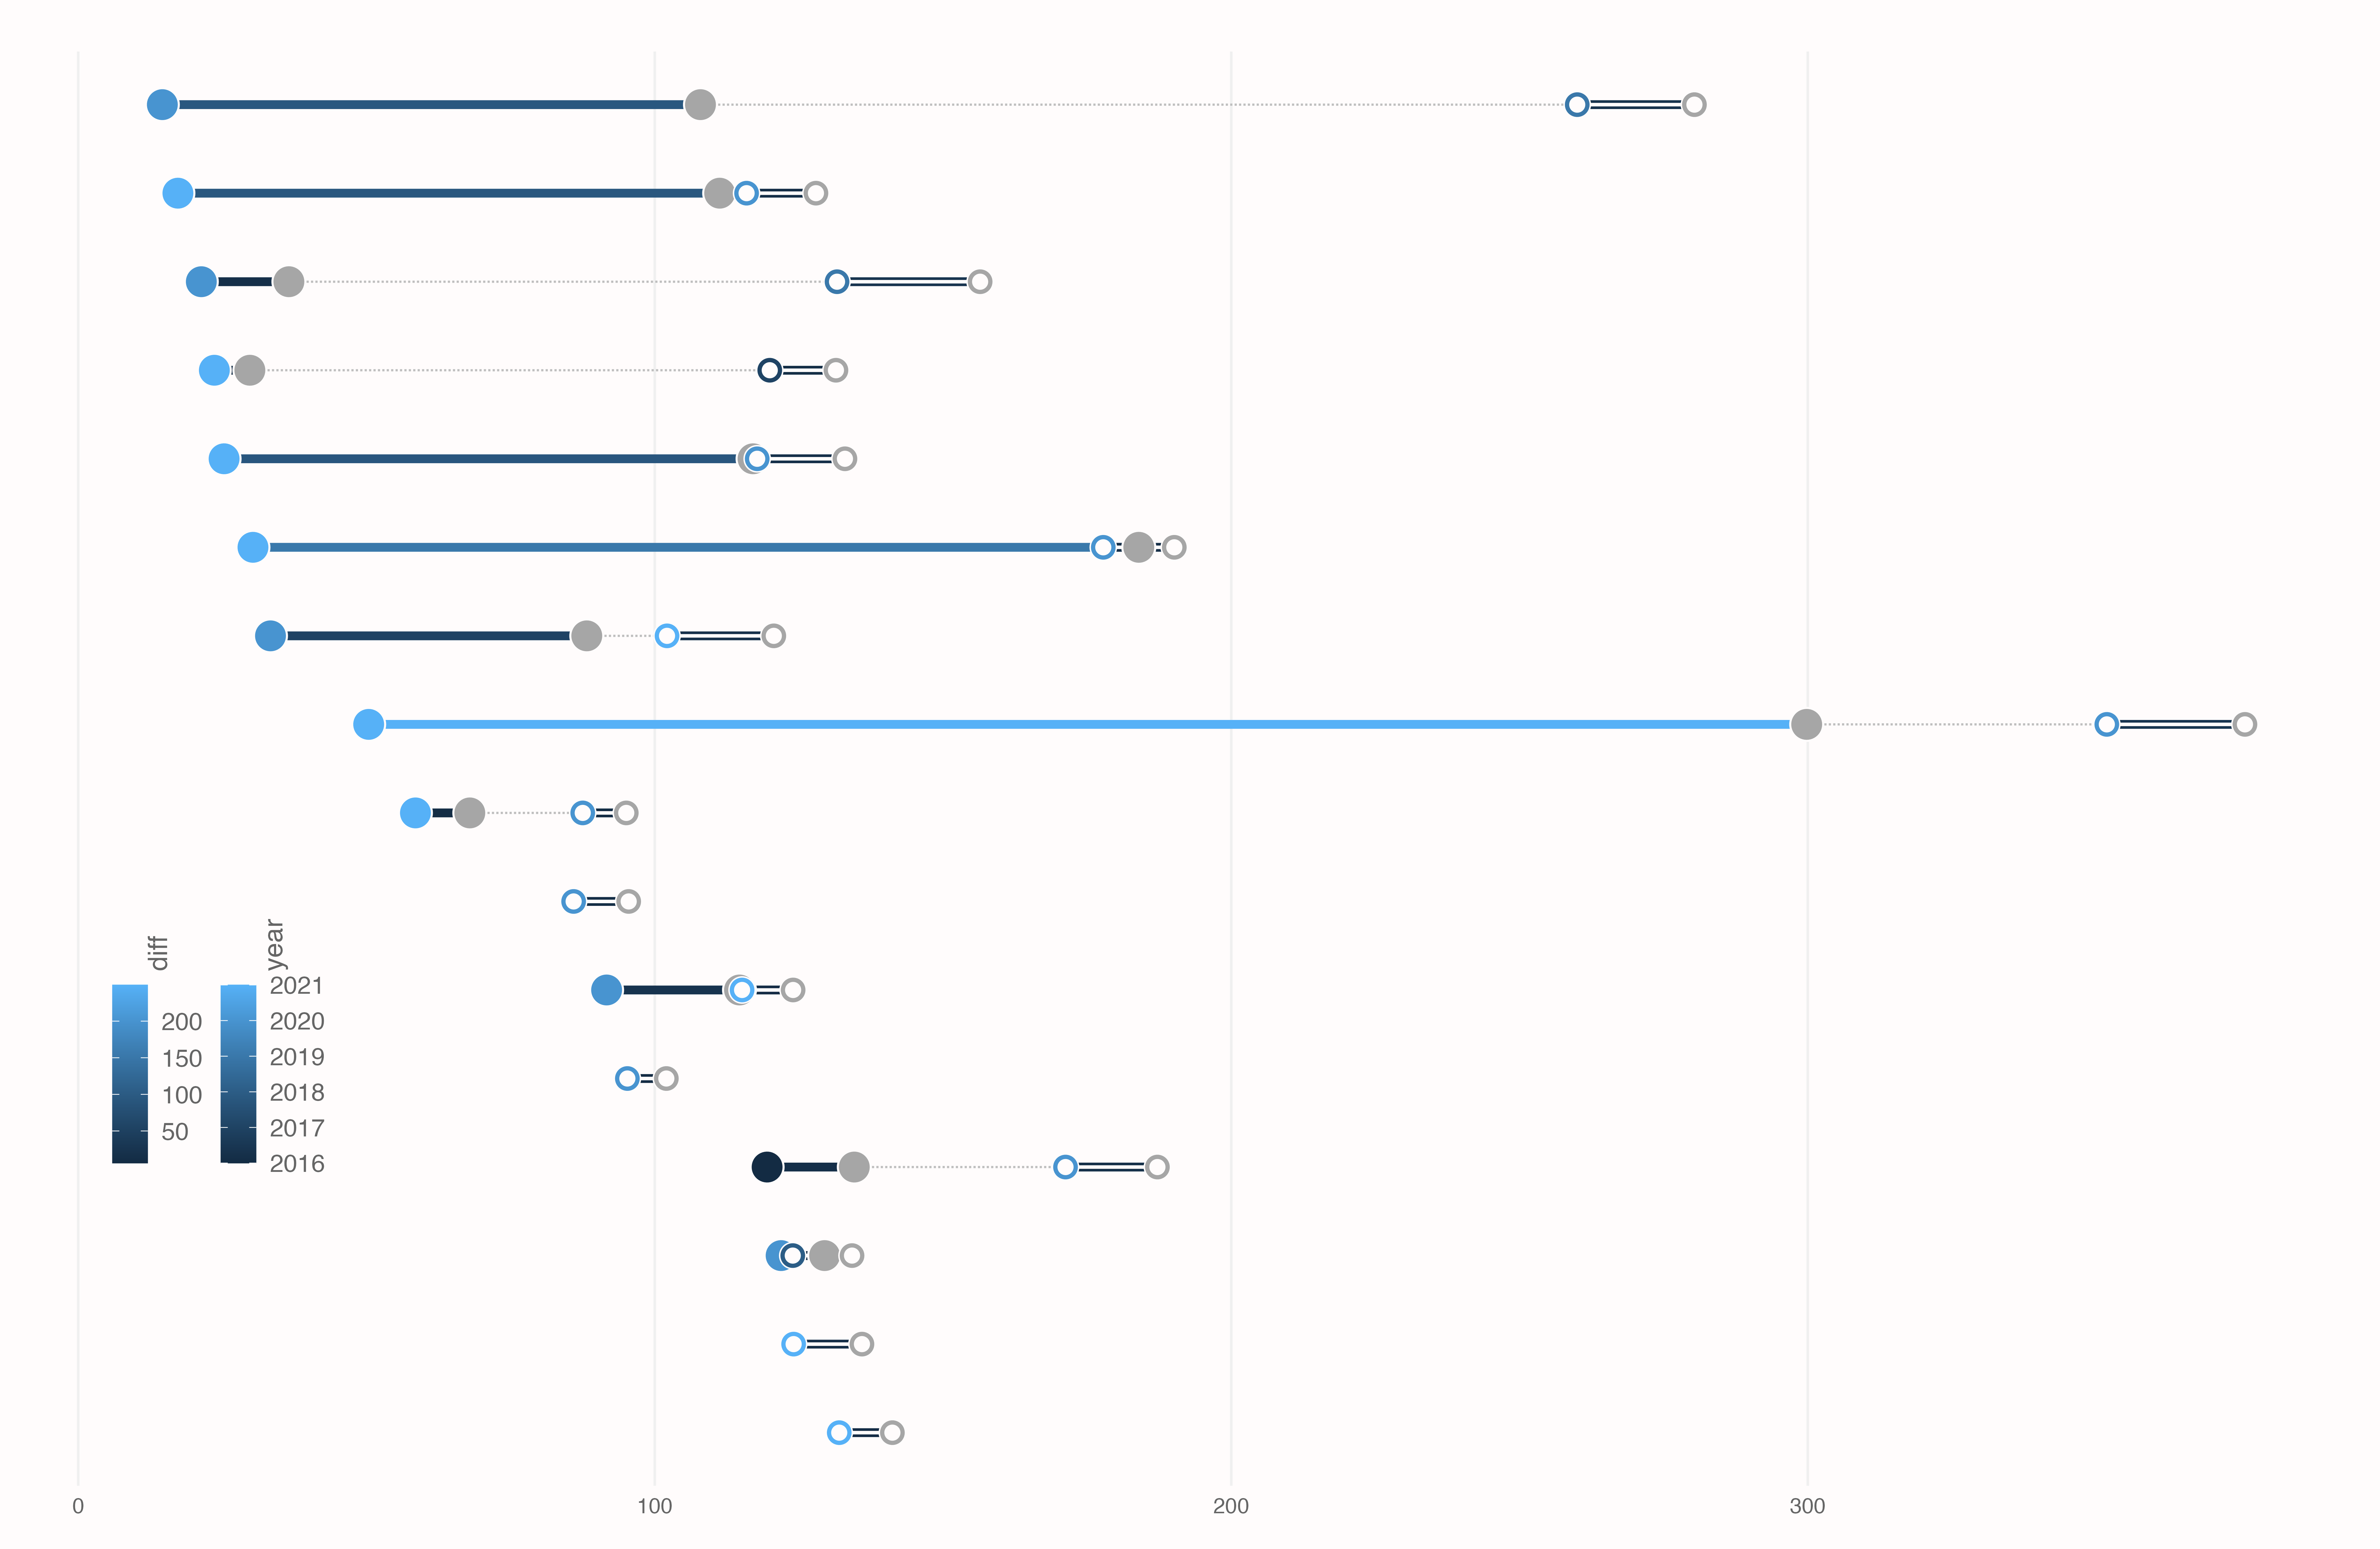
And it is now clear that records without shortcuts are represented by geoms with white centers.
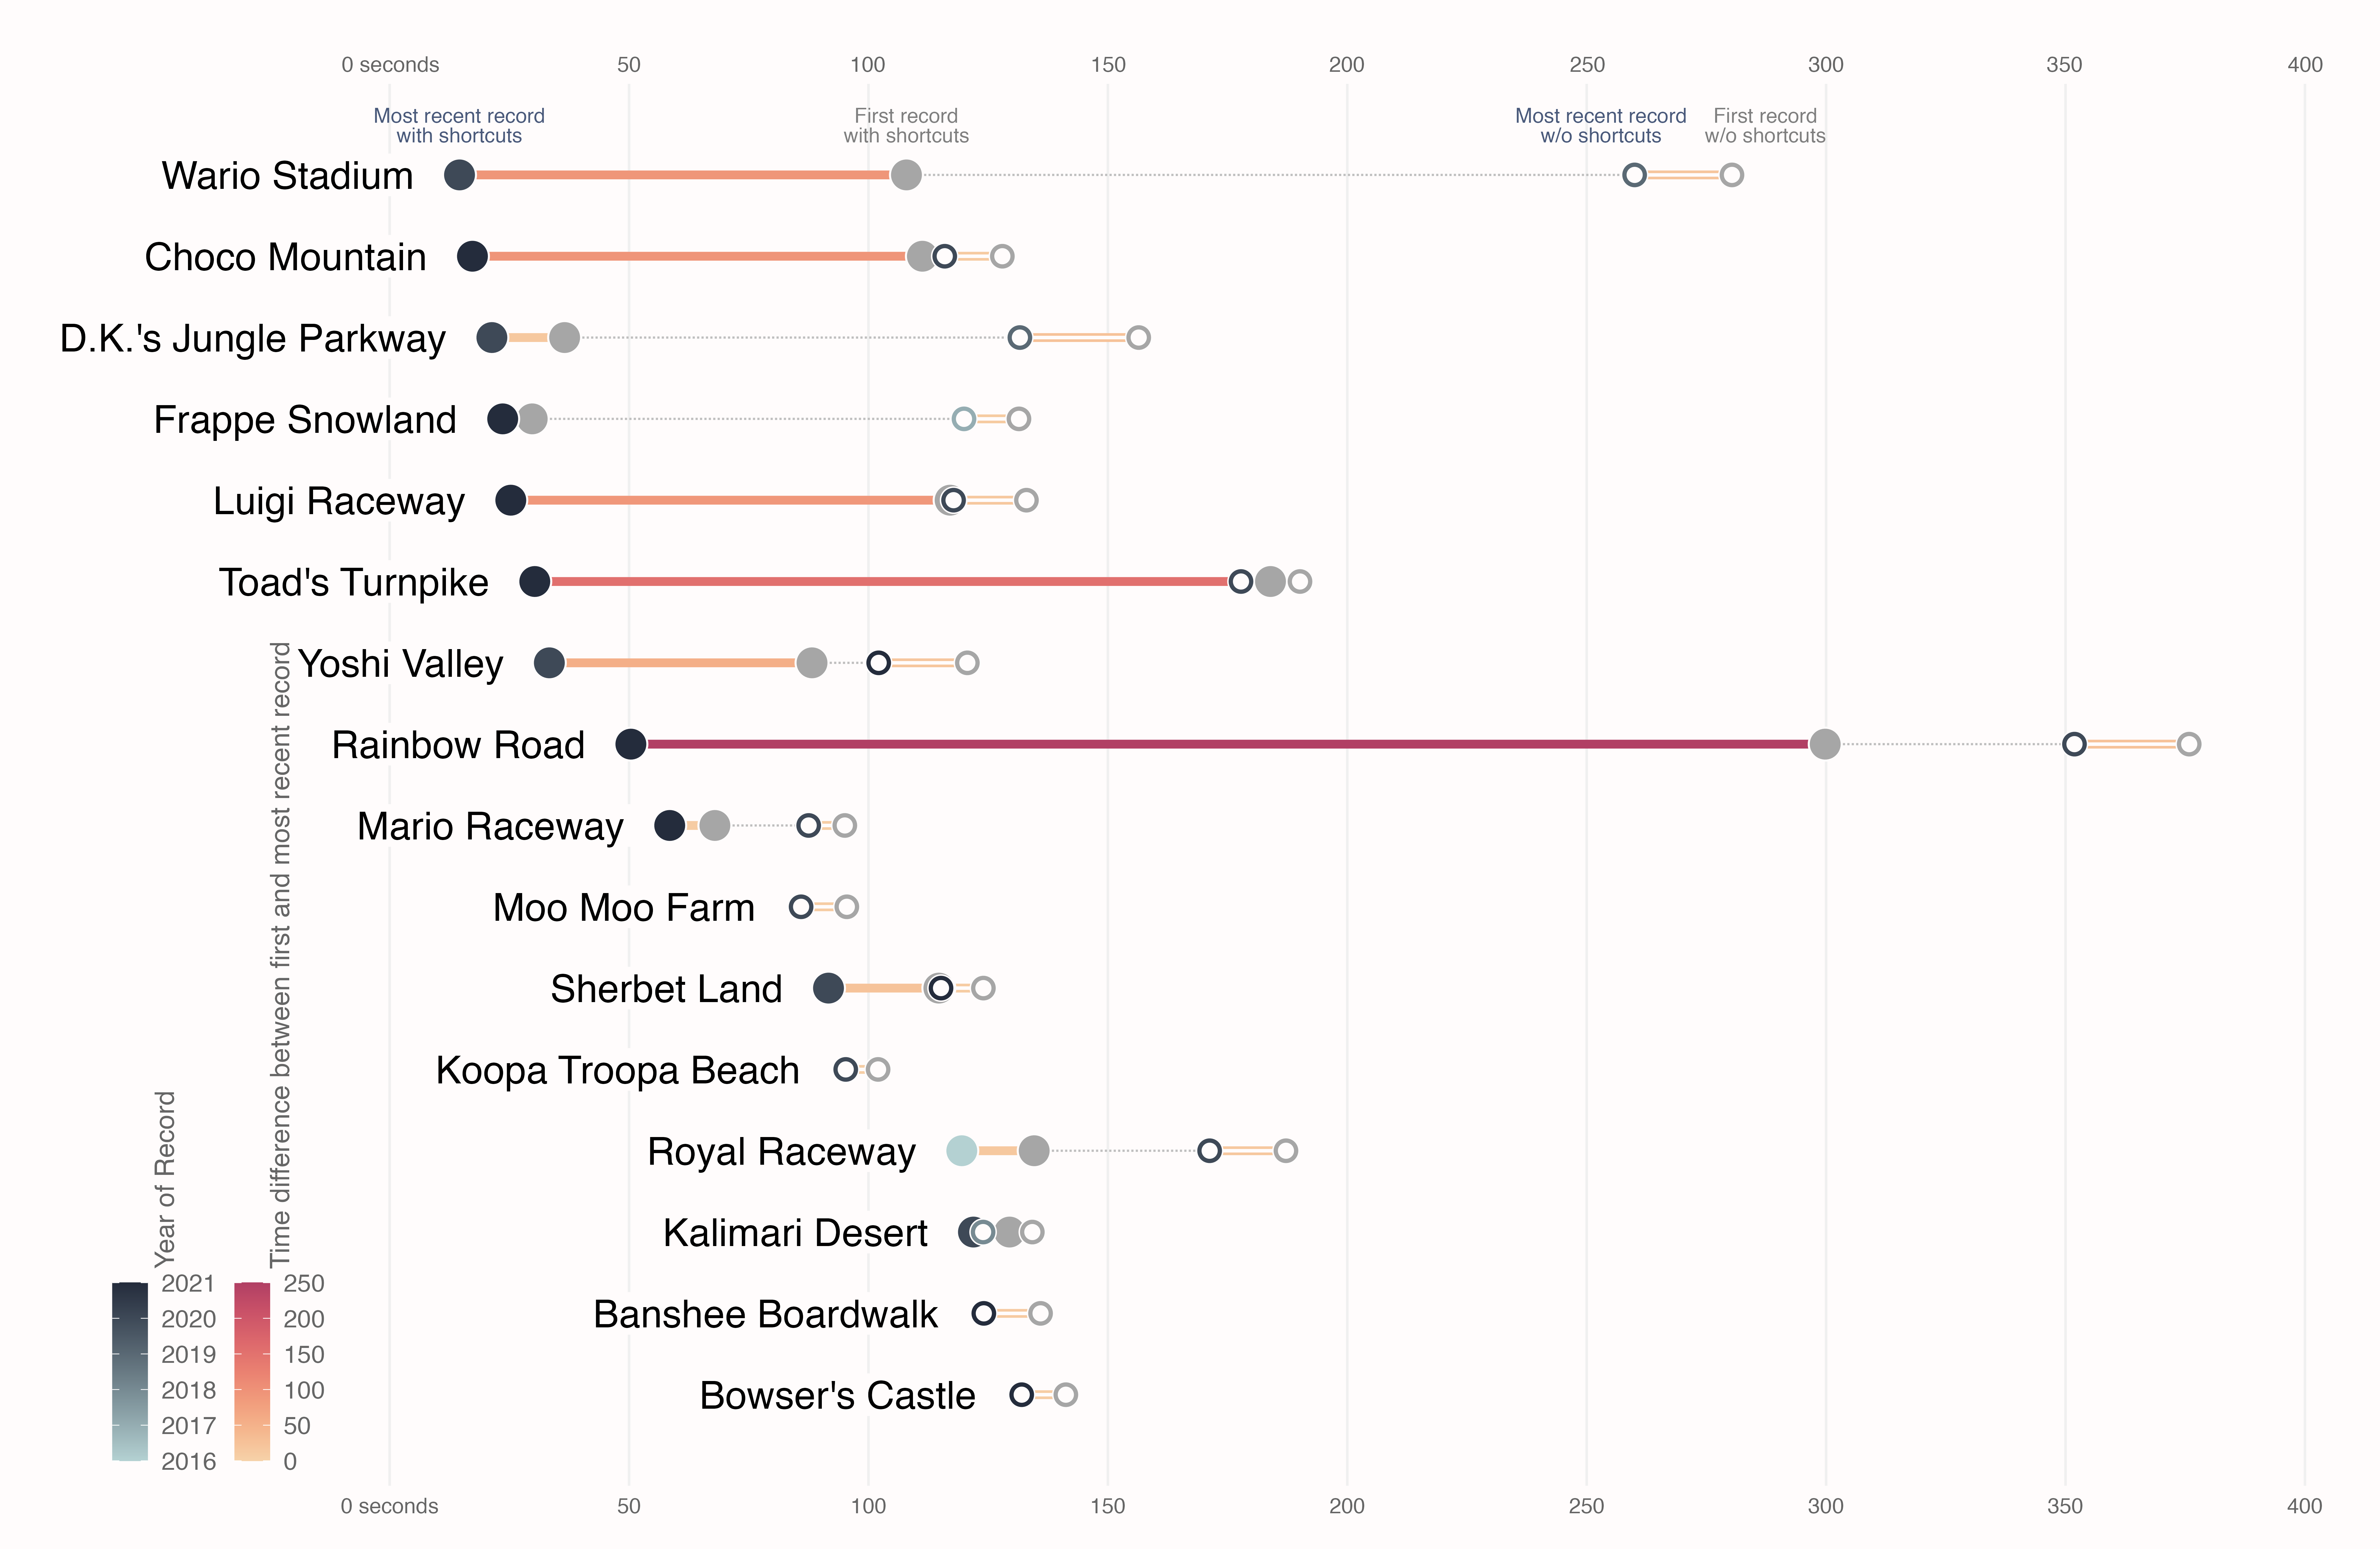
Let’s keep improving the appearence of the chart. Now it’s the turn to customize labels and legends, and add some informative text.
First, add the track labels with geom_label(). We need to
make two calls because some tracks don’t have any record without
shortcuts and so their names are taken from the
df_longdist data frame. Next, geom_text() is
used four times to label the four different types of dots and tell the
reader what they meaning. This is a very nice approach to include
information on a plot without a legend.
p <- p +
  ## labels tracks
  geom_label(aes(label = track), family = "Atlantis", size = 6.6, hjust = 1, nudge_x = -7,
             label.size = 0, fill = "#FFFCFC") +
  geom_label(data = filter(df_longdist, !track %in% unique(df_shortcut$track)),
             aes(label = track), family = "Atlantis", size = 6.6, hjust = 1, nudge_x = -7,
             label.size = 0, fill = "#FFFCFC") +
  ## labels dots when shortcut==yes
  geom_text(data = filter(df_shortcut, track == "Wario Stadium"),
             aes(label = "Most recent record\nwith shortcuts"),
             family = "Overpass", size = 3.5, color = "#4a5a7b",
             lineheight = .8, vjust = 0, nudge_y = .4) +
  geom_text(data = filter(df_shortcut, track == "Wario Stadium"),
             aes(x = max, label = "First record\nwith shortcuts"),
             family = "Overpass", size = 3.5, color = "grey50",
             lineheight = .8, vjust = 0, nudge_y = .4) +
  ## labels dots when shortcut==no
  geom_text(data = filter(df_longdist, track == "Wario Stadium"),
             aes(label = "Most recent record\nw/o shortcuts"),
             family = "Overpass", size = 3.5, color = "#4a5a7b", lineheight = .8,
             vjust = 0, nudge_x = -7, nudge_y = .4) +
  geom_text(data = filter(df_longdist, track == "Wario Stadium"),
             aes(x = max, label = "First record\nw/o shortcuts"),
             family = "Overpass", size = 3.5, color = "grey50", lineheight = .8,
             vjust = 0, nudge_x = 7, nudge_y = .4)
Then it’s the time to tweak scales and axis.
p <- p +
  # Extend horizontal axis so trackl labels fit
  coord_cartesian(xlim = c(-60, 400)) +
  scale_x_continuous(
    breaks = seq(0, 400, by = 50),
    # Add 'seconds' label only to first axis tick
    labels = function(x) ifelse(x == 0, paste(x, "seconds"), paste(x)),
    sec.axis = dup_axis(), # Add axis ticks and labels both on top and bottom.
    expand = c(.02, .02)
  ) +
  scale_y_discrete(expand = c(.07, .07)) +
  scale_fill_gradient(low = "#b4d1d2", high = "#242c3c", name = "Year of Record") +
  rcartocolor::scale_color_carto_c(
    palette = "RedOr",
    limits = c(0, 250),
    name = "Time difference between first and most recent record"
  )
Some touches to the position of the guides and their size…
p <- p +
guides(
fill = guide_legend(title.position = "left"),
color = guide_colorbar(
barwidth = unit(.45, "lines"),
barheight = unit(22, "lines"),
title.position = "left"
)
) +
labs(
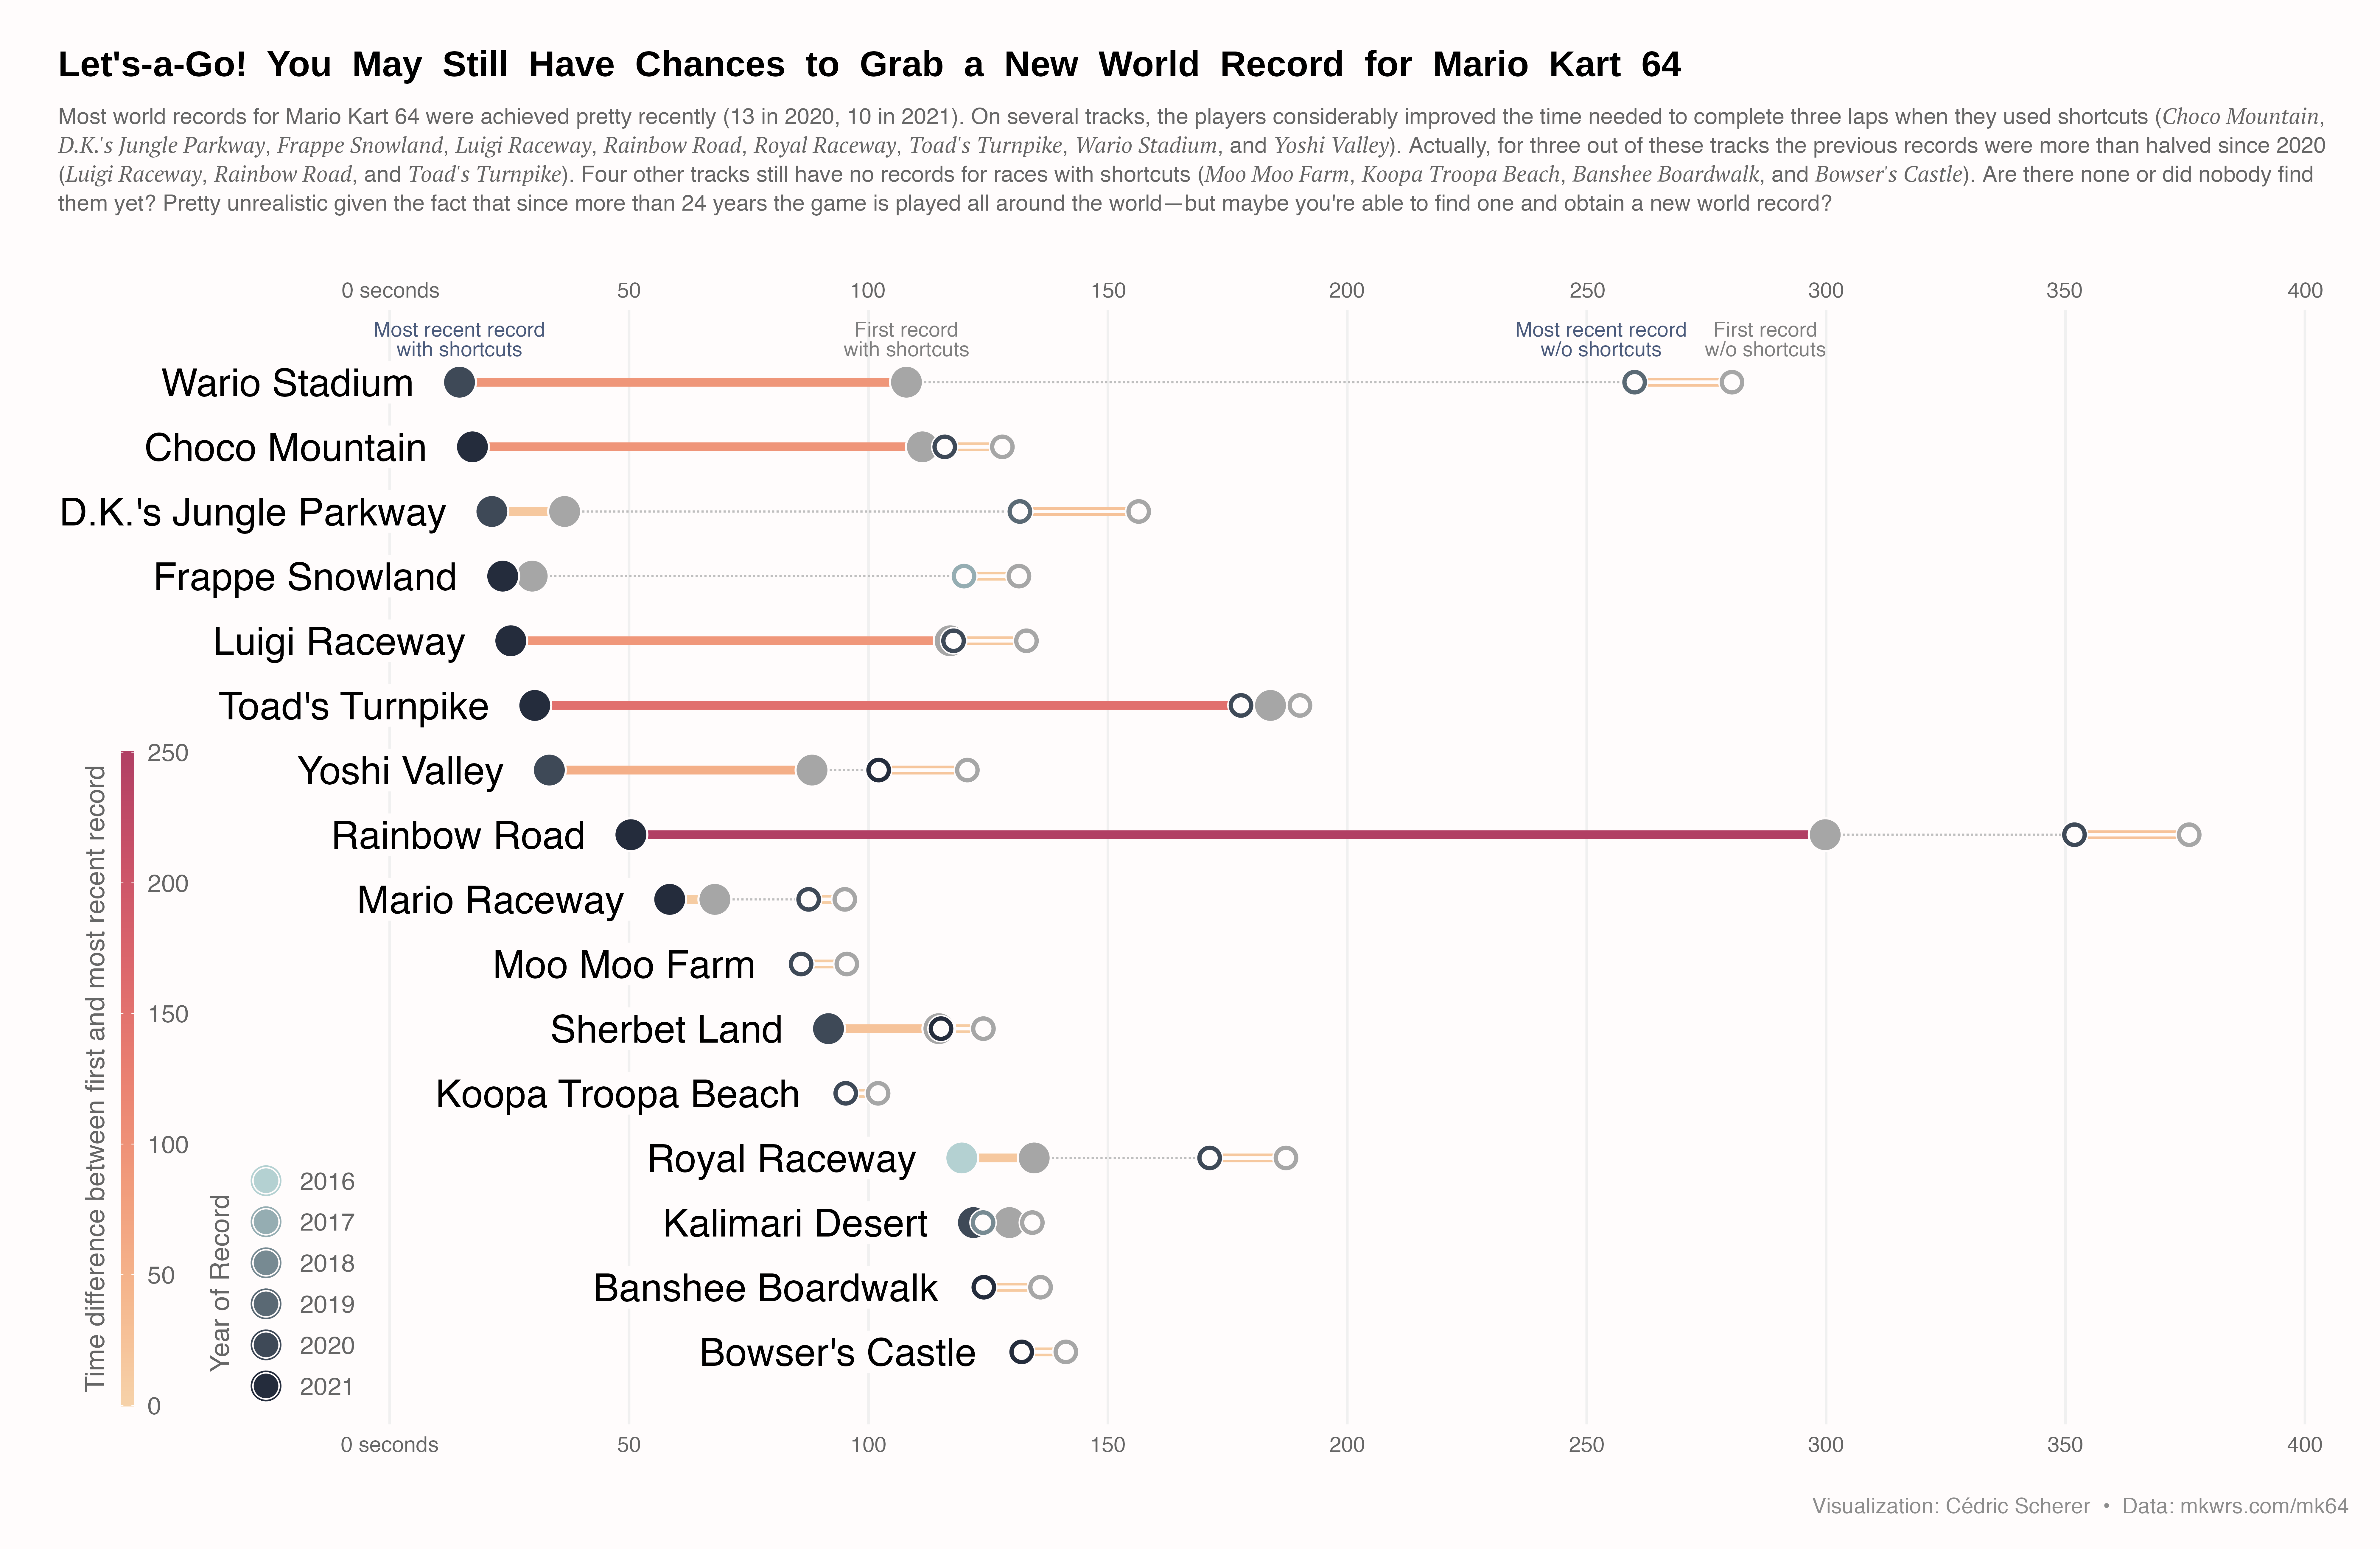
title = "Let's-a-Go! You May Still Have Chances to Grab a New World Record for Mario Kart 64",
subtitle = "Most world records for Mario Kart 64 were achieved pretty recently (13 in 2020, 10 in 2021). On several tracks, the players considerably improved the time needed to complete three laps when they used shortcuts (*Choco Mountain*, *D.K.'s Jungle Parkway*, *Frappe Snowland*, *Luigi Raceway*, *Rainbow Road*, *Royal Raceway*, *Toad's Turnpike*, *Wario Stadium*, and *Yoshi Valley*). Actually, for three out of these tracks the previous records were more than halved since 2020 (*Luigi Raceway*, *Rainbow Road*, and *Toad's Turnpike*). Four other tracks still have no records for races with shortcuts (*Moo Moo Farm*, *Koopa Troopa Beach*, *Banshee Boardwalk*, and *Bowser's Castle*). Are there none or did nobody find them yet? Pretty unrealistic given the fact that since more than 24 years the game is played all around the world—but maybe you're able to find one and obtain a new world record?",
caption = "Visualization: Cédric Scherer • Data: mkwrs.com/mk64"
)
And finally, save the plot. device = agg_png means we use
the PNG graphic device from the AGG backend previously mentioned instead
of the default PNG backend that comes with a typical installation of R.
ggsave(
  here::here("img", "lollipop-plot-with-r-mario-kart-64-world-records.png"),
  width = 7990, height = 5200, res = 500, device = agg_png, limitsize = FALSE
)
Conclusion
Here we are, with a very highly customized plot showcasing the
possibilities offered by the tidyverse and other packages like
ragg. Thanks again to Cedric for providing this chart
example!


