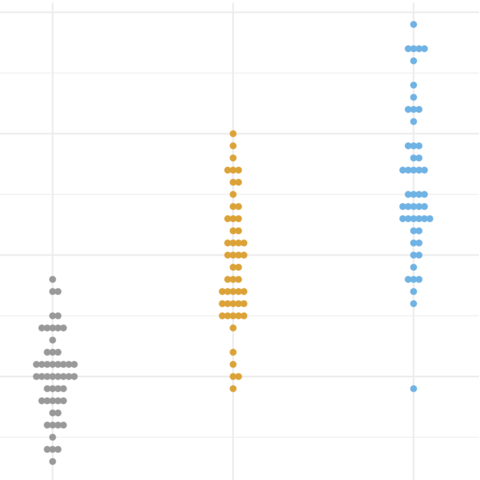
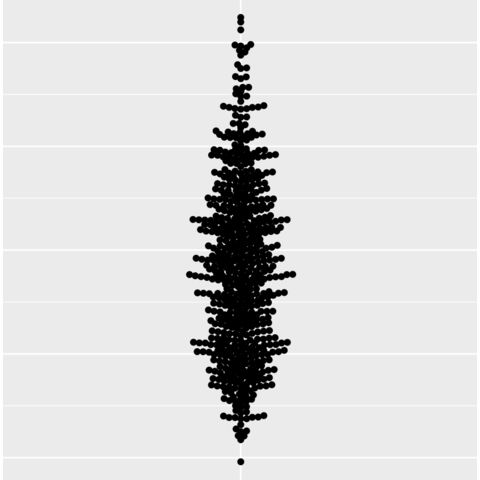
The ggbeeswarm package in R is an extension of the
ggplot2
package, designed to simplify the process of creating
beeswarm plots. This post showcases the
key features of ggbeeswarm and
provides a set of graph examples using the
package.
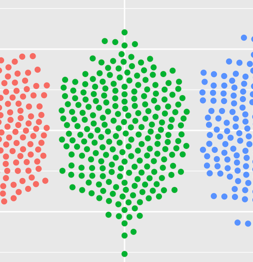
{ggbeeswarm}
The ggbeeswarm package in R is an extension of the
ggplot2
package, designed to simplify the process of creating
beeswarm plots.
It offers 2 main functions to create beeswarm plots:
geom_quasirandom() and geom_beeswarm().
βοΈ author β Erik Clarke
π documentation β github
βοΈ more than 500 stars on github
To get started with ggbeeswarm, you can install it
directly from CRAN using the install.packages function:
The ggbeeswarm package makes it easy to create beeswarm
plots using the geom_beeswarm() function.
Hereβs a basic example:
library(ggplot2)
library(ggbeeswarm)
ggplot(iris, aes(x = Species, y = Sepal.Length, colour=Species)) +
geom_beeswarm()
ggplot(iris, aes(x = Species, y = Sepal.Length, colour=Species)) +
geom_beeswarm() +
theme_minimal() +
scale_color_manual(values = c("#00AFBB", "#E7B800", "#FC4E07"))
Thanks to the size argument, you can change the
size of the dots. Here is an example with
size=3:
ggplot(iris, aes(x = Species, y = Sepal.Length, colour=Species)) +
geom_beeswarm(size=3) +
theme_minimal()
There are multiple methods to position the dots.
Here is an example with method = "center":
ggplot(iris, aes(x = Species, y = Sepal.Length, colour=Species)) +
geom_beeswarm(method = "center") +
theme_minimal()
You can split the plot by a variable using the
split argument.
With side=1L it will be on the
right side of the axis and with
side=-1L it will be on the
left side of the axis.
ggplot(iris, aes(x = Species, y = Sepal.Length, colour=Species)) +
geom_beeswarm(side = -1L) +
theme_minimal()
For more beeswarm example, you can check the dedicated section of the R graph gallery.
π After crafting hundreds of R charts over 12 years, I've distilled my top 10 tips and tricks. Receive them via email! One insight per day for the next 10 days! π₯