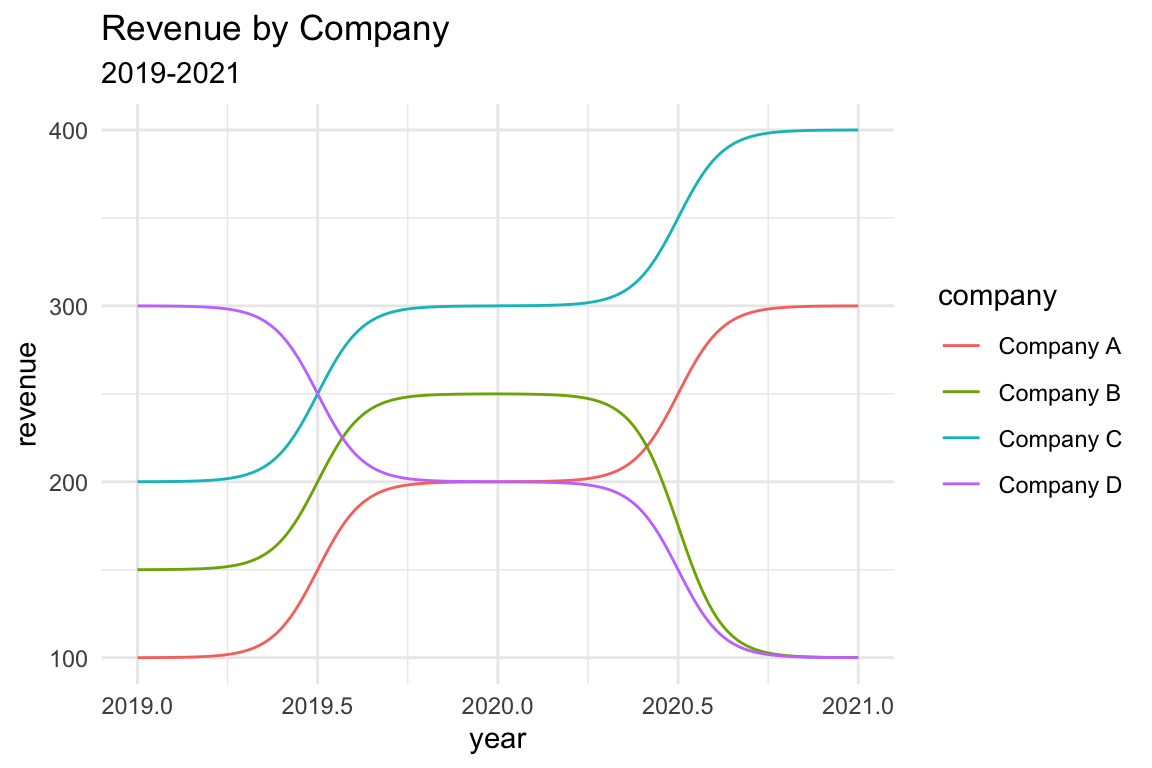
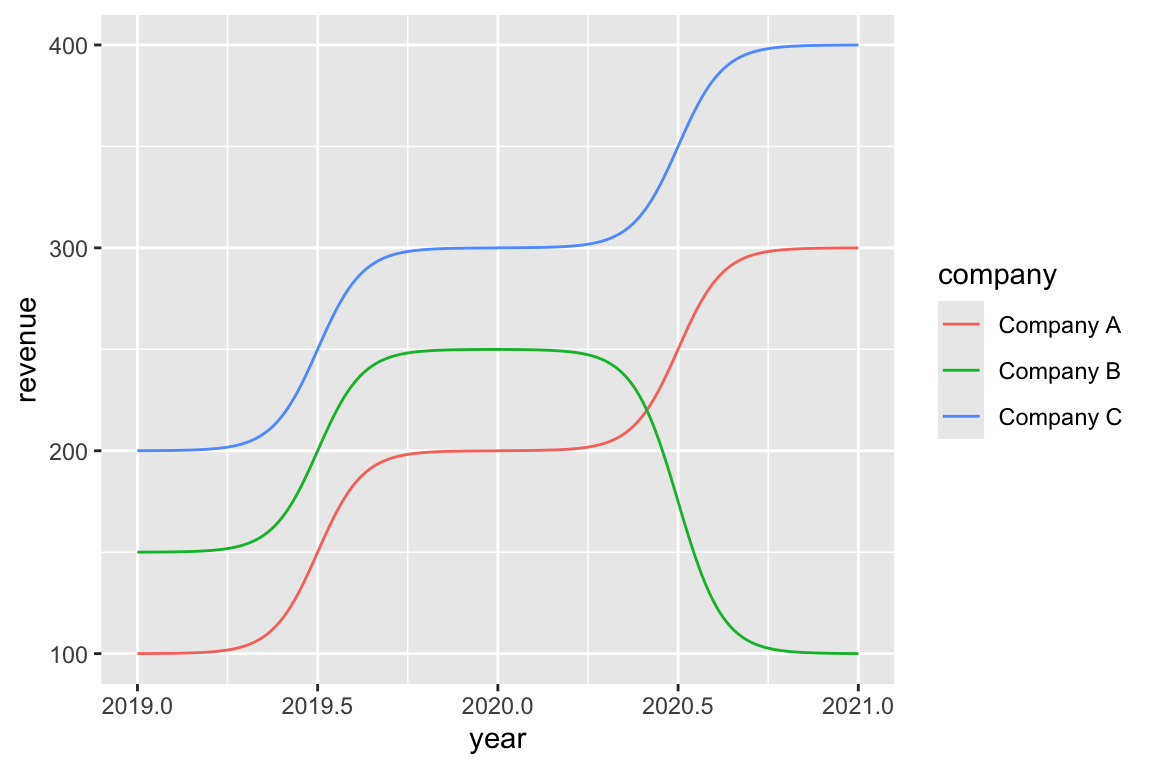
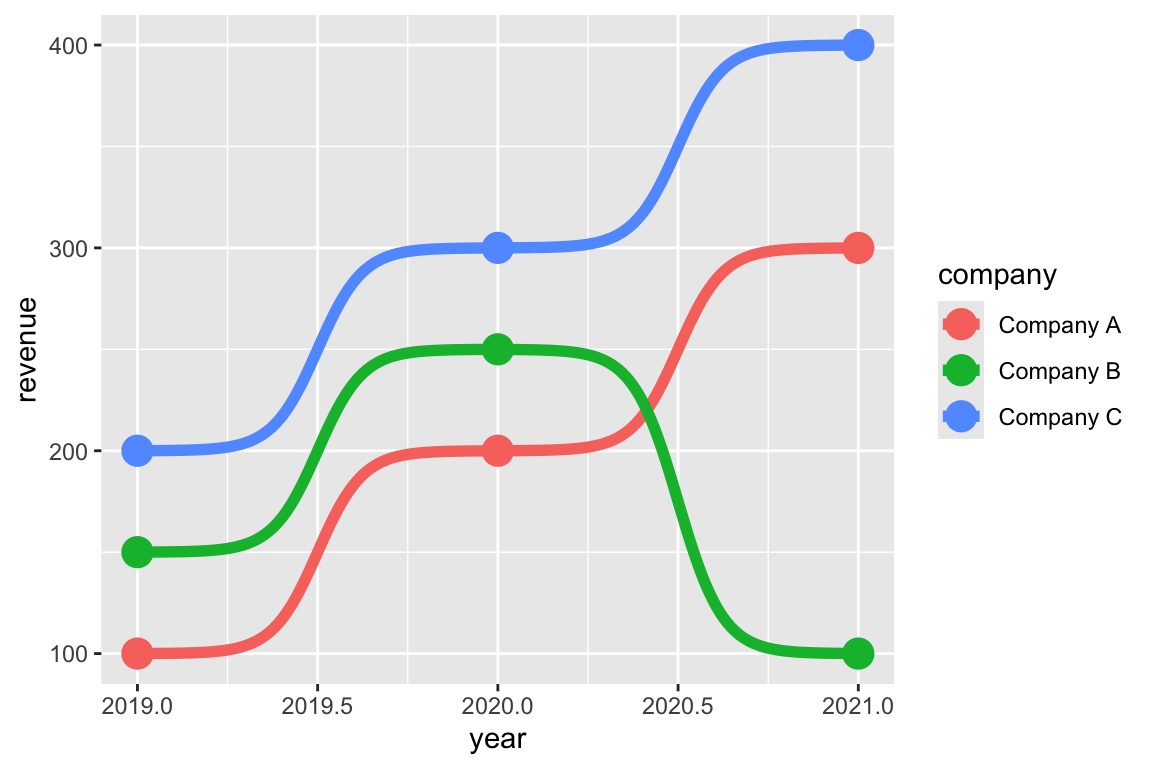
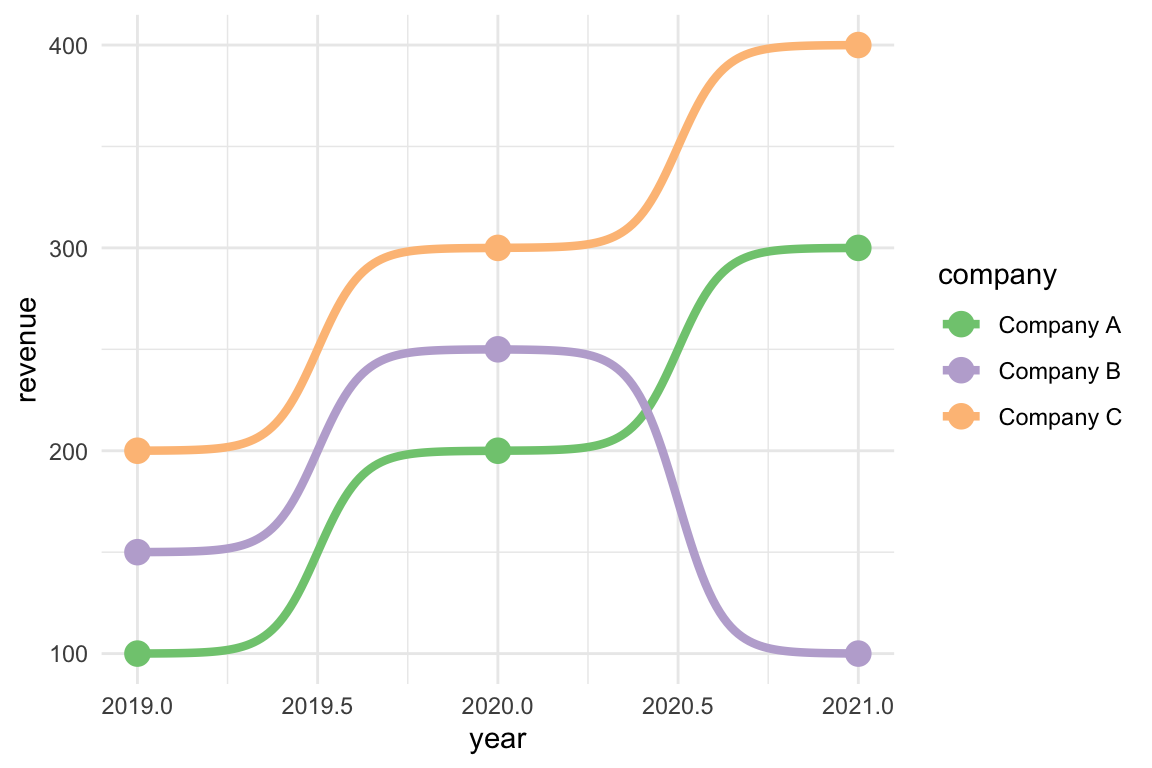
The ggbump package in R is an
extension of the ggplot2
package, designed to simplify the process of building bump
plots.
This post showcases the key features of
ggbump and provides a set of graph
examples using the package.
{ggbump}
The ggbump package in R is an extension of the ggplot2
package, designed to create bump plots, which is a
variant of the parallel coordinates
plot
To get started with ggbump, you can install it directly
from CRAN using the install.packages function:
We start by creating a simple dataset with three columns:
year, revenue, and company.
year <- rep(2019:2021, 3)
revenue <- c(
100, 200, 300,
150, 250, 100,
200, 300, 400
)
company <- c(
"Company A", "Company A", "Company A",
"Company B", "Company B", "Company B",
"Company C", "Company C", "Company C"
)
df <- data.frame(
year = year,
revenue = revenue,
company = company
)Next, we create a ggplot object using the
df dataset and the geom_bump function from
ggbump.

You can easily combine geom_bump() with
geom_point() to display individual points on the plot.
Example:

The examples from the gallery will help you understand the
capabilities of the ggbump package and how to use
it in concrete cases.
👋 After crafting hundreds of R charts over 12 years, I've distilled my top 10 tips and tricks. Receive them via email! One insight per day for the next 10 days! 🔥