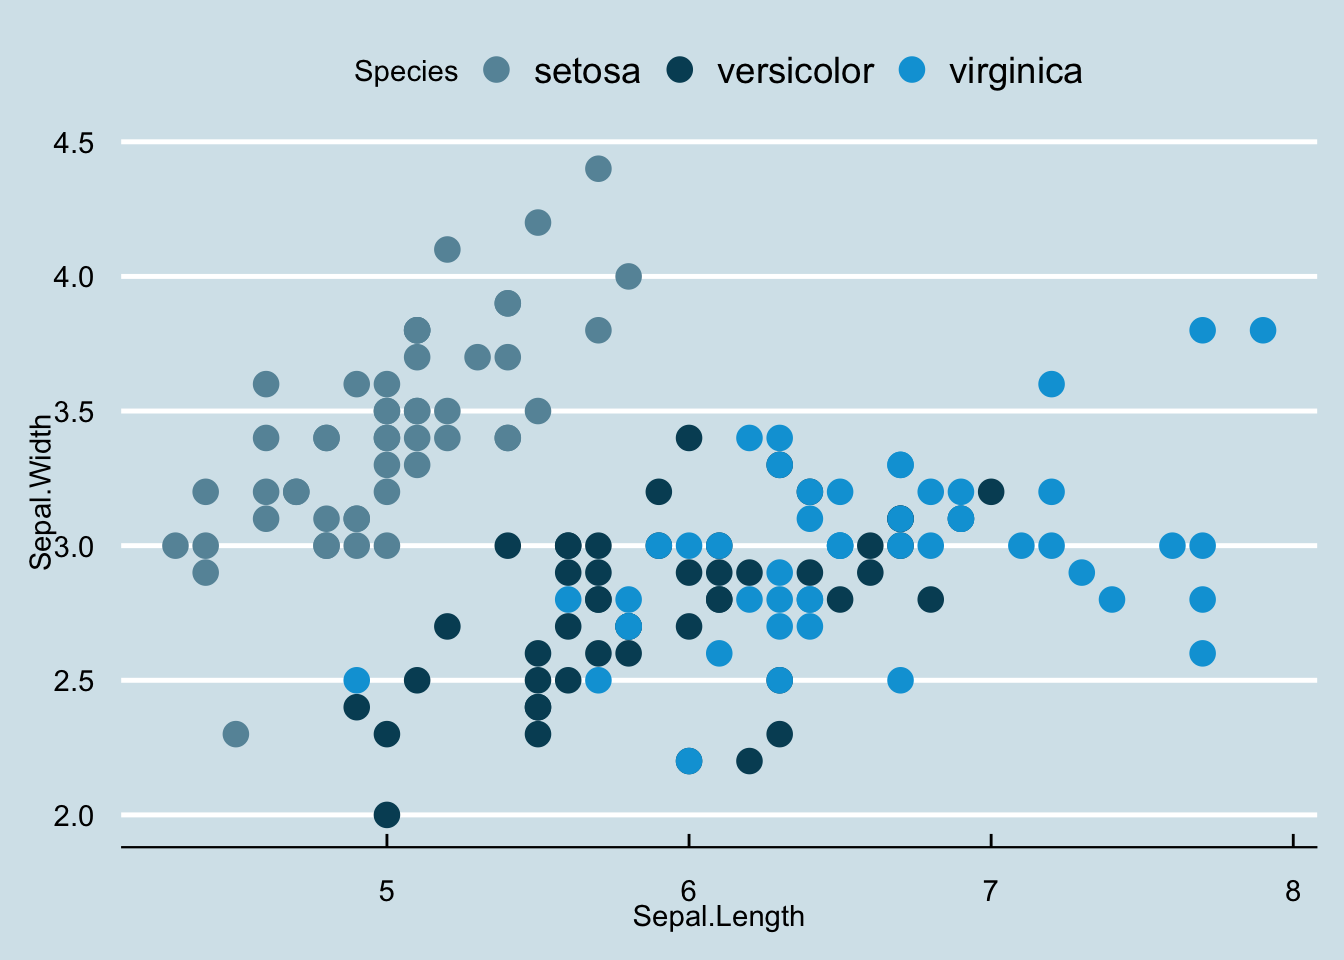
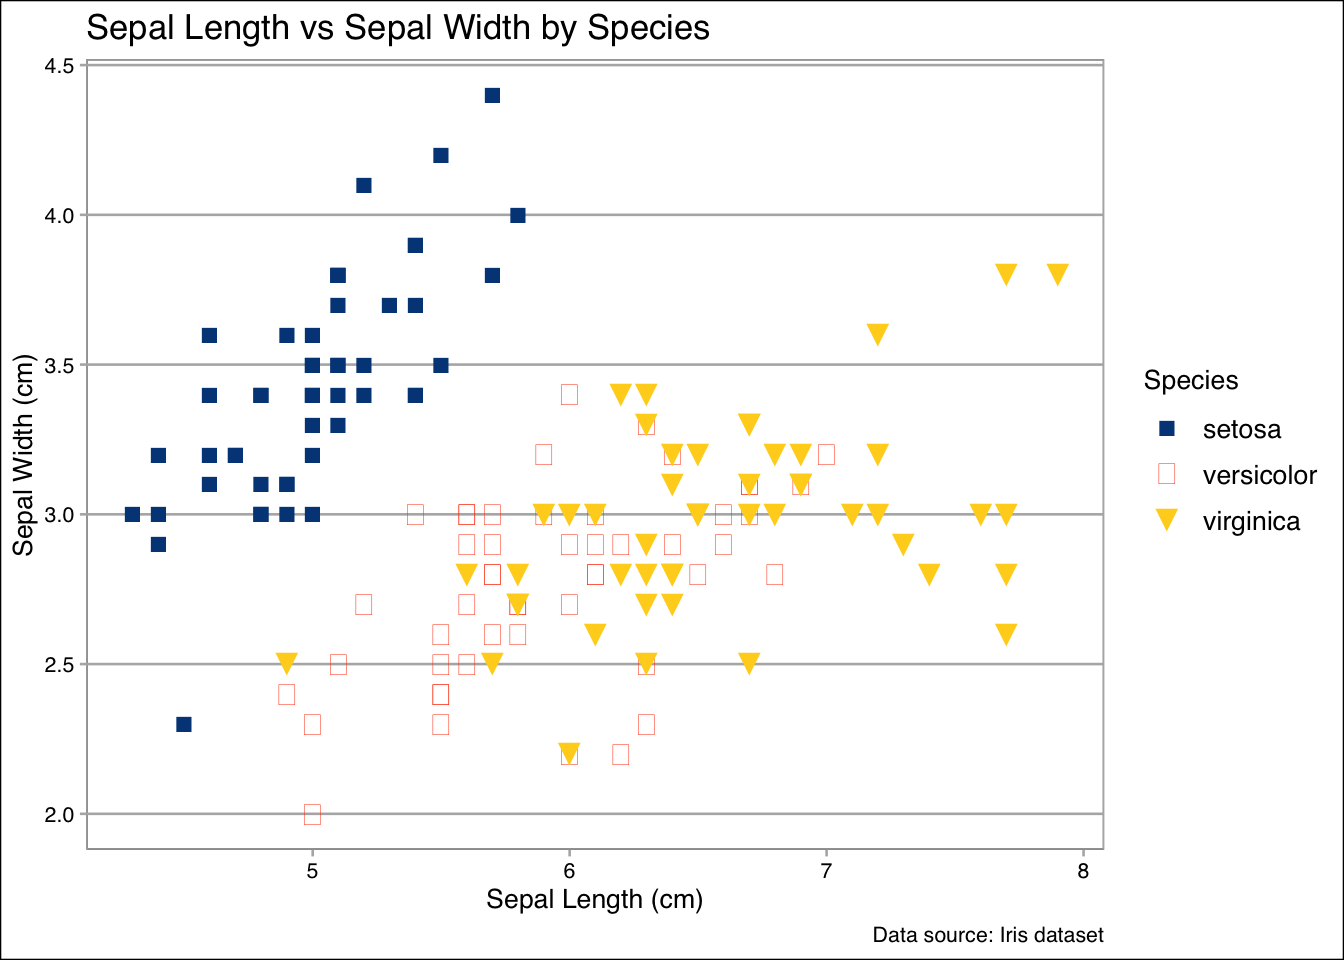
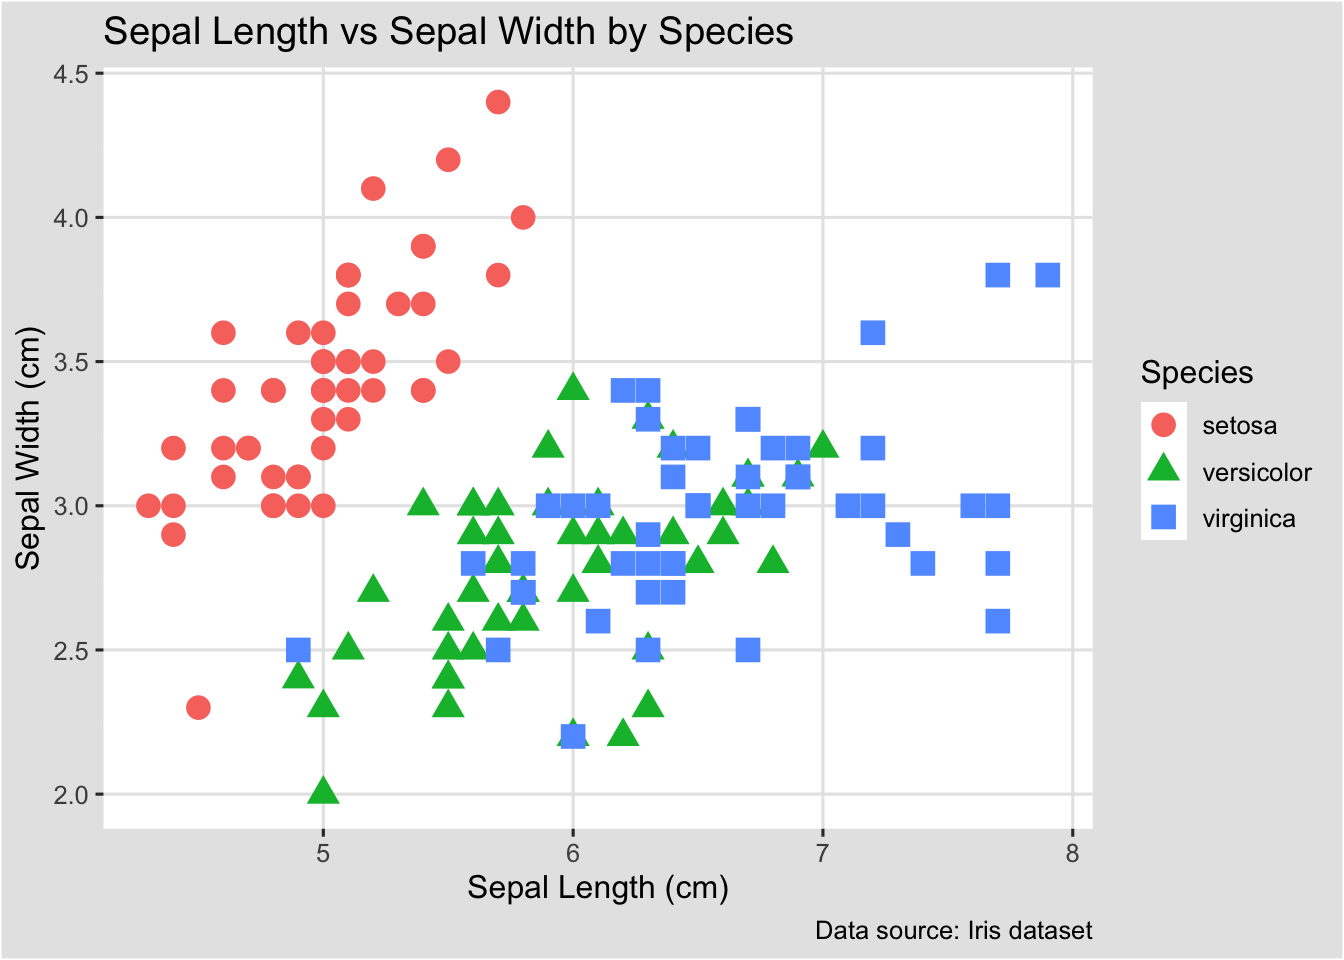
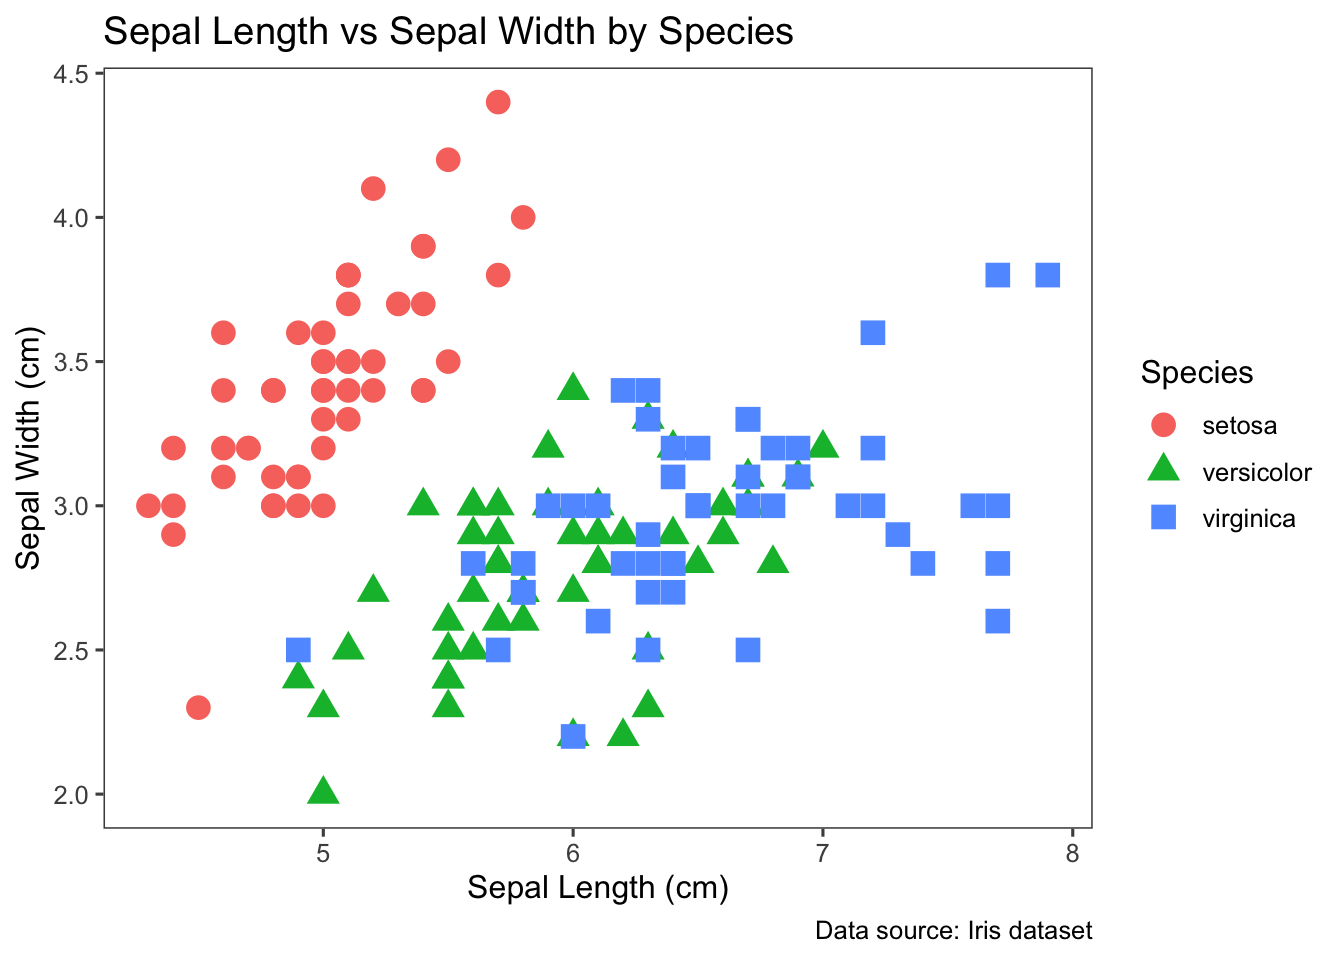
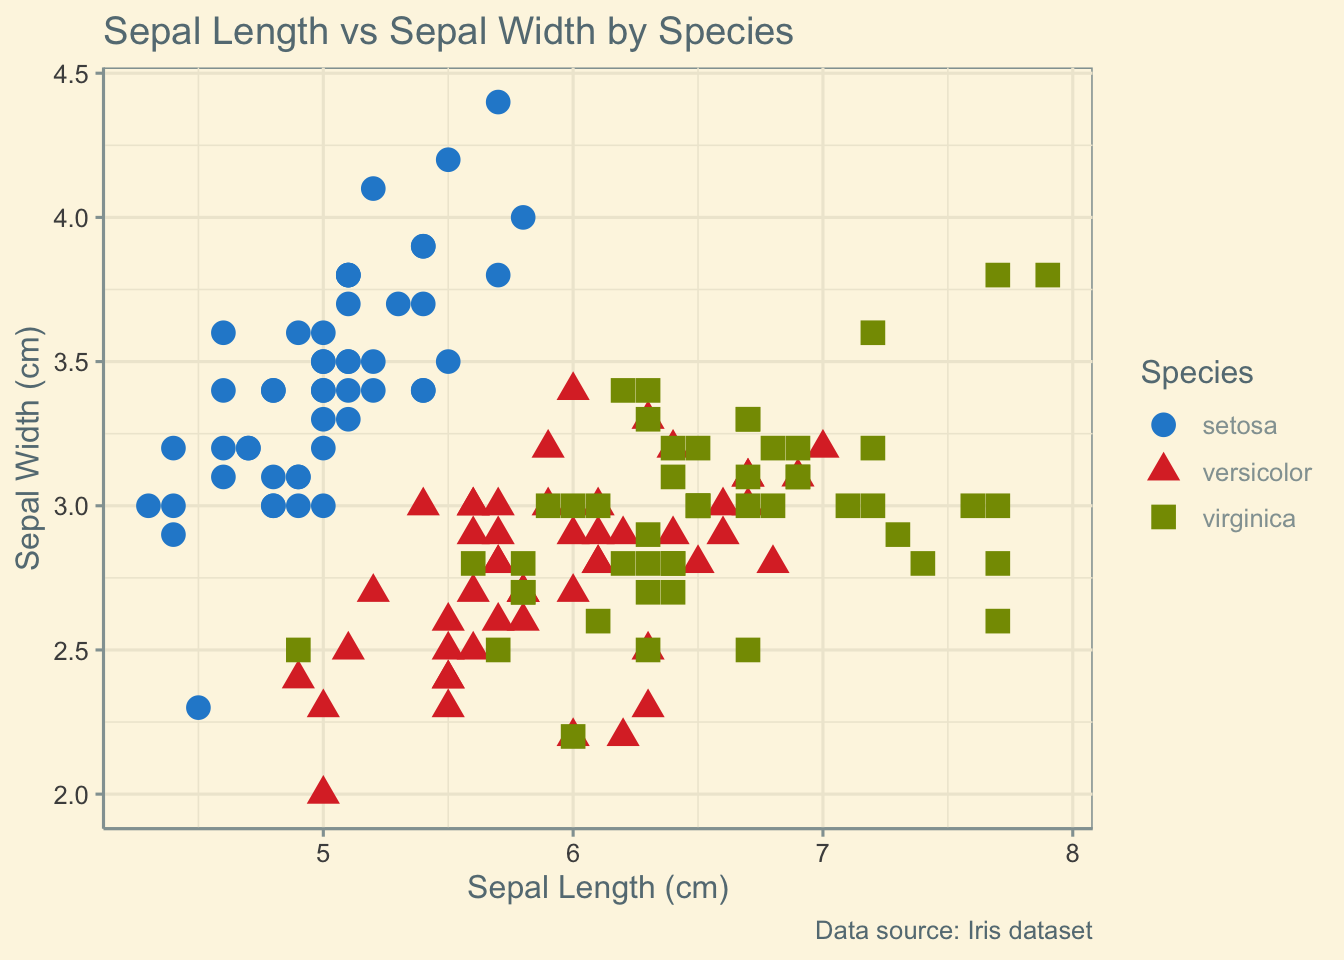
The ggthemes
package in R is an extension of
ggplot2, offering a
collection of additional themes and scales for
ggplot2 charts.
This post showcases the
key features of ggthemes
and
provides a set of graph examples using the
package.
{ggthemes}
The ggthemes
package in R extends
ggplot2 by providing additional
themes and scales inspired by various sources,
including popular data visualization styles and software.
It offers a set of pre-built themes that can be easily applied to ggplot2 charts to quickly change their appearance.
βοΈ author β Jeffrey Arnold
π documentation β github
βοΈ more than 1000 stars on github
To get started with ggthemes
, you can install it directly
from CRAN using the install.packages
function:
The ggthemes
package allows you to apply pre-built themes
to your ggplot2 charts using the theme_*()
functions.
Hereβs a basic example:
library(ggplot2)
library(ggthemes)
p <- ggplot(iris, aes(x = Sepal.Length, y = Sepal.Width, color = Species, shape = Species)) +
geom_point(size = 4) +
labs(
title = "Sepal Length vs Sepal Width by Species",
x = "Sepal Length (cm)",
y = "Sepal Width (cm)",
caption = "Data source: Iris dataset"
)
p + theme_economist()
ggthemes
provides a wide range of
pre-built themes inspired by various
sources.
It includes a comprehensive set of
theme_*()
functions that can transform
the overall appearance of a chart, as well as several
additional functions such as:
scale_color_*()
: maps data to the color
aesthetic
scale_shape_*()
: maps data to the shape
aesthetic
This allows for easy and seamless integration of theme, color, and shape in any chart.
The following examples will demonstrate excellent combinations of these functions and their visual impact!
π After crafting hundreds of R charts over 12 years, I've distilled my top 10 tips and tricks. Receive them via email! One insight per day for the next 10 days! π₯