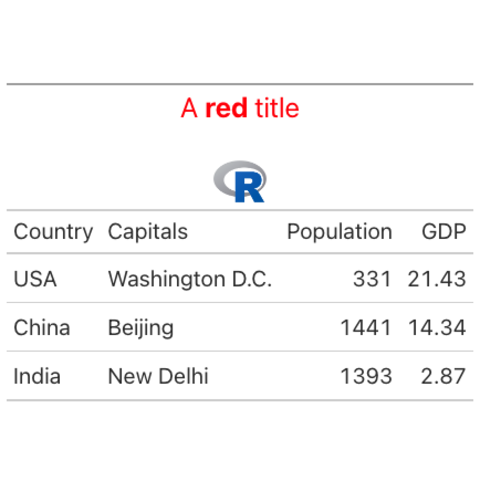
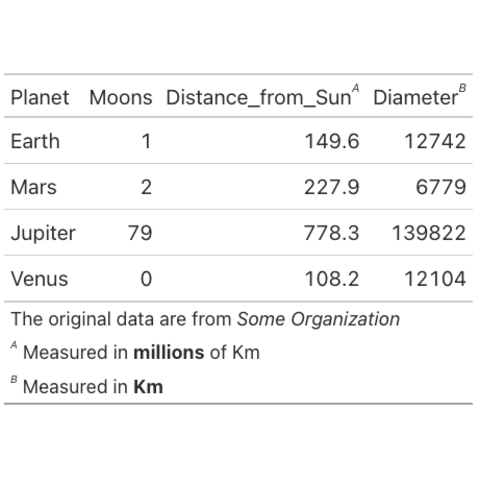
Create beautiful tables with gt


The gt package in R is a powerful tool for creating elegant and customizable tables for data visualization and reporting. It offers a user-friendly way to design and style tables in RMarkdown documents and Shiny applications.

Documentation

{gt}

Quick start


The gt package in R is a powerful tool for creating elegant and customizable tables for data visualization and reporting.

It offers options for formatting, styling, and theming tables, as well as support for handling complex data structures and creating publication-ready tables with ease.

✍️ author → Richard Iannone

📘 documentationgithub

⭐️ more than 1000 stars on github

Country Population GDP
USA 331.00 21.43
China 1.44 M 14.34
India 1.39 M 2.87
Brazil 212.00 1.49

Installation


To get started with gt, you can install it directly from CRAN using the install.packages function:

install.packages("gt")

Basic usage


We generally use the dplyr package in combination of gt for better code readability.

Here’s a basic example with default rendering:

library(gt)
library(dplyr)

# Create a simple data frame
data = data.frame(
  Country = c("USA", "China", "India", "Brazil"),
  Capitals = c("Washington D.C.", "Beijing", "New Delhi", "Brasília"),
  Population = c(331, 1441, 1393, 212),
  GDP = c(21.43, 14.34, 2.87, 1.49)
)

# Alternatively you can do (same output):
#gt(data)

# Use the gt function
data %>%
  gt()
Country Capitals Population GDP
USA Washington D.C. 331 21.43
China Beijing 1441 14.34
India New Delhi 1393 2.87
Brazil Brasília 212 1.49

Key features


→ Title and Subtitle

You can add and customize title and subtitle with the tab_header() function. Moreover, by using the md() function we can insert some markdown styling inside the texts.

Example:

data %>%
  gt() %>%
    tab_header(title = md("What a **nice title**"),
               subtitle = md("Pretty *cool subtitle* too, `isn't it?`"))
What a nice title
Pretty cool subtitle too, isn't it?
Country Capitals Population GDP
USA Washington D.C. 331 21.43
China Beijing 1441 14.34
India New Delhi 1393 2.87
Brazil Brasília 212 1.49

→ Sub-header

The tab_spanner() function lets you group columns into categories.

Example:

data %>%
  gt() %>%
   tab_spanner(
    label = "Number",
    columns = c(GDP, Population)) %>%
  tab_spanner(
    label = "Label",
    columns = c(Country, Capitals)
  )
Label Number
Country Capitals GDP Population
USA Washington D.C. 21.43 331
China Beijing 14.34 1441
India New Delhi 2.87 1393
Brazil Brasília 1.49 212


Contact

This document is a work by Yan Holtz. Any feedback is highly encouraged. You can fill an issue on Github, drop me a message on Twitter, or send an email pasting yan.holtz.data with gmail.com.

Github Twitter