Network Analysis with igraph


The igraph package in R is a powerful tool for network analysis and visualization. It provides a wide range of functions for creating, manipulating, and analyzing graphs and networks.
This post showcases the key features of igraph and provides a set of graph examples using the package.
Documentation

{igraph}

Quick start


The igraph package in R is a comprehensive toolkit for network analysis and visualization. It provides functionality for creating, manipulating, and analyzing various types of graphs and networks.

It offers a wide range of algorithms and visualization techniques for working with network data.

✍️ author → Gábor Csárdi, Kirill Müller

📘 documentationigraph.org

⭐️ more than 500 stars on github

Installation


To get started with igraph, you can install it directly from CRAN using the install.packages function:

install.packages("igraph")

Vocabulary


Key components of a graph in igraph:

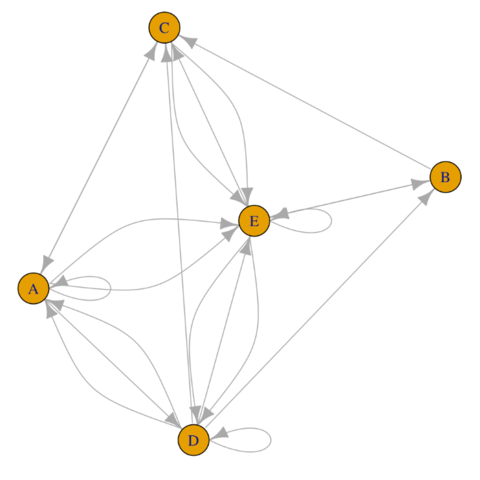
Create a graph object


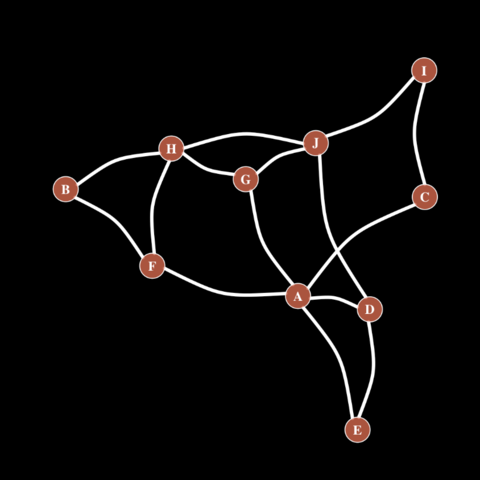
The igraph package offers 3 different ways to create a graph object:

library(igraph)
set.seed(1)

# Create a graph from an adjacency matrix
data <- matrix(sample(0:2, 25, replace = TRUE), nrow = 5)
colnames(data) <- rownames(data) <- LETTERS[1:5]
network <- graph_from_adjacency_matrix(data)

# Create a graph from an incidence matrix
data <- matrix(sample(0:2, 15, replace = TRUE), nrow = 3)
colnames(data) <- letters[1:5]
rownames(data) <- LETTERS[1:3]
network <- graph_from_incidence_matrix(data)

# Create a graph from an edge list
links <- data.frame(
  source = c("A", "A", "A", "A", "A", "F", "B"),
  target = c("B", "B", "C", "D", "F", "A", "E")
)
network <- graph_from_data_frame(d = links, directed = F)

Learn more about how to create a graph object

# Plot the graph
plot(network)

Key features


→ Creating Graphs

You can create graphs using various functions like make_graph(), sample_gnm(), or graph_from_edgelist().

Example:

  • sample_gnm(10, 20) creates a random graph with 10 vertices and 20 edges
  • The resulting graph is visualized using plot(g)
# Create a random graph
g <- sample_gnm(10, 20)
plot(g)


→ Community Detection

You can detect communities in networks using various algorithms.

Example:

  • cluster_louvain(g) applies the Louvain community detection algorithm to the graph
  • plot(comm, g) visualizes the graph with nodes colored by their detected communities
# Detect communities using the Louvain method
comm <- cluster_louvain(g)
plot(comm, g)


→ Graph Layouts

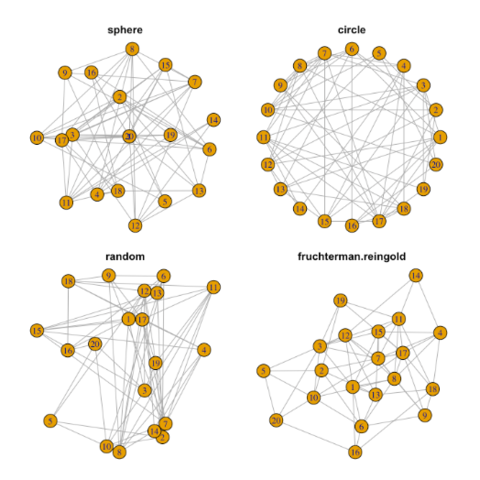
igraph offers various layout algorithms for visualizing graphs.

Example:

  • layout_with_fr(g) computes a force-directed layout for the graph
  • The layout is then used in plot(g, layout = layout) to visualize the graph
# Use a force-directed layout
layout <- layout_with_fr(g)
plot(g, layout = layout)

Discover more layouts


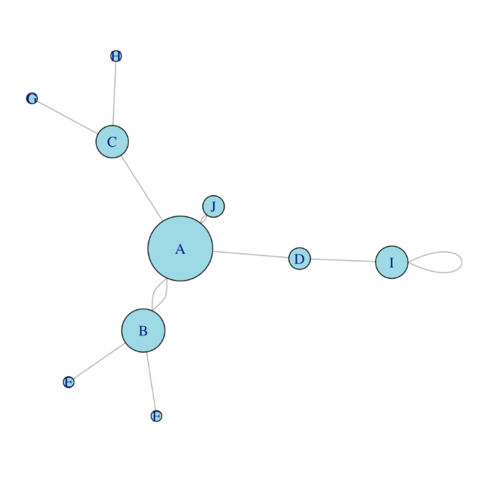
Customizing Graph Appearance

  • We create a scale-free network using sample_pa()
  • Vertex sizes are set proportional to their degrees
  • Vertex colors are assigned based on degree using a rainbow palette
  • Edge widths are set based on edge betweenness centrality
  • The graph is plotted with curved edges and without vertex labels
# Create a scale-free network
g <- sample_pa(100, power = 1, m = 1, directed = FALSE)

# Customize the graph appearance
V(g)$size <- degree(g) * 2 # Vertex size based on degree
V(g)$color <- rainbow(100)[cut(degree(g), breaks = 100)] # Vertex color based on degree
E(g)$width <- edge_betweenness(g) * 0.03 # Edge width based on betweenness

# Plot the customized graph
plot(g,
  vertex.label = NA, # Remove vertex labels
  edge.curved = 0.2, # Add curve to edges
  layout = layout_with_fr(g)
)

Learn more about customizing igraph plots


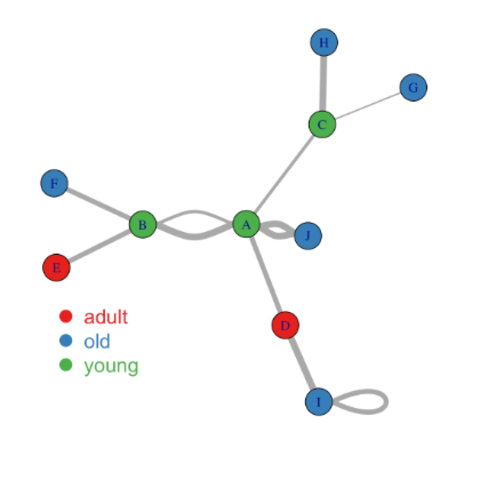
Visualizing Weighted Graphs

Explanation:

  • We create a weighted graph from a data frame of edges
  • Edge widths in the plot are proportional to their weights
  • Vertices are arranged in a circular layout
# Create a weighted graph
edges <- data.frame(
  from = sample(1:10, 20, replace = TRUE),
  to = sample(1:10, 20, replace = TRUE),
  weight = runif(20)
)
g <- graph_from_data_frame(edges, directed = FALSE)

# Plot the weighted graph
plot(g,
  edge.width = E(g)$weight * 8, # Edge width based on weight
  vertex.size = 20,
  vertex.color = "lightblue",
  vertex.label.color = "black",
  edge.color = "gray50",
  layout = layout_in_circle(g)
)

Learn more about visualizing weighted graphs


Interactive Graph Visualization

For interactive graph visualization, you can use the visNetwork package, which integrates well with igraph:

  • We create a graph using sample_pa()
  • Node and edge data are prepared for visNetwork
  • The interactive visualization allows zooming, panning, and node selection
library(visNetwork)

# Create a graph
g <- sample_pa(50, power = 1, m = 1, directed = FALSE)

# Prepare node and edge data
nodes <- data.frame(
  id = 1:vcount(g),
  label = 1:vcount(g),
  size = degree(g) * 3
)
edges <- as_data_frame(g, what = "edges")

# Create an interactive visualization
interative_graph <- visNetwork(nodes, edges) %>%
  visIgraphLayout() %>%
  visOptions(highlightNearest = TRUE, nodesIdSelection = TRUE)

htmltools::save_html(interative_graph, "../HtmlWidget/interactive-network.html")


Going further


→ Graph Analysis

igraph provides numerous functions for analyzing graph properties.

Example:

  • degree(g) calculates the degree centrality for each vertex in the graph (number of connections each vertex has)
# Calculate degree centrality
deg <- degree(g)
print(deg)
##  [1] 8 4 4 3 4 1 1 3 3 2 1 4 5 5 1 2 2 3 2 3 1 2 2 1 1 1 1 1 1 2 2 1 1 3 1 1 1 1
## [39] 1 1 1 1 2 1 1 1 1 1 1 1


→ Graph Algorithms

igraph offers a wide range of graph algorithms for various tasks.

Example:

  • shortest_paths(g, from = 1) calculates the shortest paths from vertex 1 to all other vertices in the graph
# Calculate shortest paths
shortest <- shortest_paths(g, from = 1)
print(shortest$vpath[1:5])
## [[1]]
## + 1/50 vertex, from 0e6c005:
## [1] 1
## 
## [[2]]
## + 2/50 vertices, from 0e6c005:
## [1] 1 2
## 
## [[3]]
## + 2/50 vertices, from 0e6c005:
## [1] 1 3
## 
## [[4]]
## + 2/50 vertices, from 0e6c005:
## [1] 1 4
## 
## [[5]]
## + 3/50 vertices, from 0e6c005:
## [1] 1 3 5


→ Community Detection

You can use different community detection algorithms to identify groups of vertices in a graph.

Example:

  • cluster_edge_betweenness(g) applies the edge betweenness community detection algorithm to the graph
# Detect communities using edge betweenness
comm <- cluster_edge_betweenness(g)
print(comm)
## IGRAPH clustering edge betweenness, groups: 7, mod: 0.73
## + groups:
##   $`1`
##   [1]  1  6  7 31 39 49
##   
##   $`2`
##   [1]  2  8 15 28 38 50
##   
##   $`3`
##   [1]  3 10 35 37
##   
##   $`4`
##   + ... omitted several groups/vertices


❤️ 10 best R tricks ❤️

👋 After crafting hundreds of R charts over 12 years, I've distilled my top 10 tips and tricks. Receive them via email! One insight per day for the next 10 days! 🔥