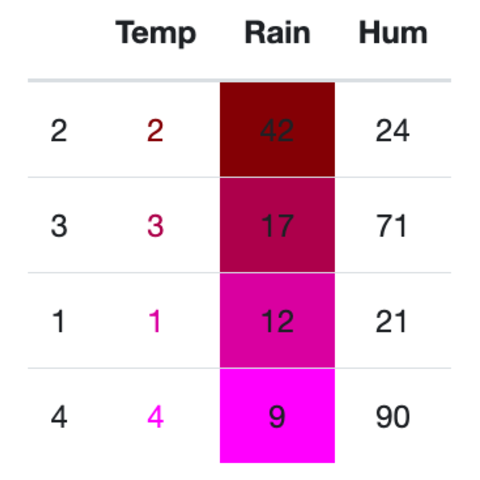
Beaufitul HTML tables with kableExtra


This post explains how to create and style tables using the kableExtra.
This package uses the kable() function from knitr to generate table output and add features on top of it by adding layers. 
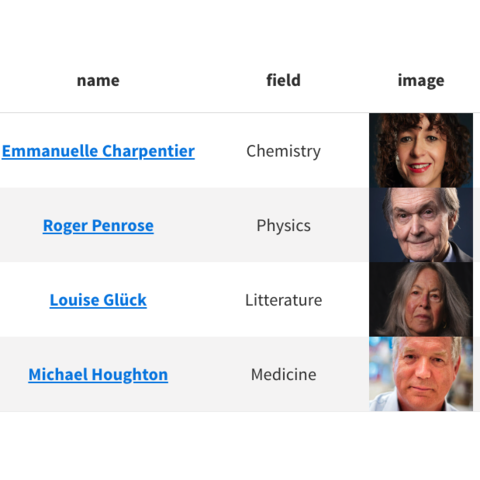
We’ll showcase the key features of kableExtra and provides a set of table examples using the package.

Documentation

{kableExtra}

Quick start


The kableExtra package offers style features from html and css with a syntax based on the pipe symbol %>%.

The kable() function comes from knitr, a package designed for dynamic report generation in R.

It will generate a table from a data frame and the kableExtra package will add features on top of it, such as adding images, footnotes, HTML tags, URL links (look at the Sepal.Width column on the right), and so on within table cells.

✍️ author → Hao Zhu

📘 documentationgithub

⭐️ more than 500 stars on github

Sepal.Length Sepal.Width Petal.Length Petal.Width Species
5.1 3.5 1.4 0.2 setosa
4.9 3.0 1.4 0.2 setosa
4.7 3.2 1.3 0.2 setosa
4.6 3.1 1.5 0.2 setosa
5.0 3.6 1.4 0.2 setosa
5.4 3.9 1.7 0.4 setosa
4.6 3.4 1.4 0.3 setosa
5.0 3.4 1.5 0.2 setosa

Installation


To get started with kableExtra, you can install it directly from CRAN using the install.packages function:

install.packages("kableExtra")

Basic usage


The kableExtra package has multiple themes: kable_paper, kable_classic, kable_classic_2, kable_minimal, kable_material and kable_material_dark.

Here’s a basic example with the dark one:

library(kableExtra)
data(iris)

head(iris) %>%
  kbl() %>%
  kable_styling() %>%
  kable_material_dark(c("striped", "hover"))
Sepal.Length Sepal.Width Petal.Length Petal.Width Species
5.1 3.5 1.4 0.2 setosa
4.9 3.0 1.4 0.2 setosa
4.7 3.2 1.3 0.2 setosa
4.6 3.1 1.5 0.2 setosa
5.0 3.6 1.4 0.2 setosa
5.4 3.9 1.7 0.4 setosa

Key features


→ Colors

You can personalized every color aspect of the table. In this example we show 5 different ways to apply a color, a gradient of colors or a list of colors to kable columns.

Example:

library(kableExtra)
data(iris)
df = iris[order(iris$Petal.Length, decreasing = T),] # sort by petal length value

# gradient color
colfunc = colorRampPalette(c("purple", "orange"))
n_color = 8
colors = colfunc(n_color) # generate 8 colors, from purple to orange

# generate the table
head(df, 8) %>%
  kbl(align = "c") %>% # center the columns
  kable_styling() %>%
  kable_paper(c("striped", "hover")) %>% # add strips and hover
  column_spec(2, color='red') %>%
  column_spec(3, background=colors) %>%
  column_spec(4, color=colors) %>%
  column_spec(5, background='lightblue') %>%
  column_spec(6, color=c("pink","pink","pink","yellow","pink","green","pink","pink"))
Sepal.Length Sepal.Width Petal.Length Petal.Width Species
119 7.7 2.6 6.9 2.3 virginica
118 7.7 3.8 6.7 2.2 virginica
123 7.7 2.8 6.7 2.0 virginica
106 7.6 3.0 6.6 2.1 virginica
132 7.9 3.8 6.4 2.0 virginica
108 7.3 2.9 6.3 1.8 virginica
110 7.2 3.6 6.1 2.5 virginica
131 7.4 2.8 6.1 1.9 virginica

→ Chart in cells

The kableExtra package proposes 3 plotting tools: spec_hist, spec_boxplot, and spec_plot. We split the iris dataset according to the Species column.

Example:

library(kableExtra)
data(iris)
df = data.frame(Species = c('Setosa', 'Versicolor', 'Virginica'),
                boxplots = "", histograms = "", plots1 = "", plots2 = "")
sepal_length_list = split(iris$Sepal.Length, iris$Species)

df %>%
  kbl(booktabs = TRUE) %>%
  kable_styling() %>%
  kable_paper(full_width = TRUE) %>%
  column_spec(2, image = spec_boxplot(sepal_length_list)) %>%
  column_spec(3, image = spec_hist(sepal_length_list)) %>%
  column_spec(4, image = spec_plot(sepal_length_list, same_lim = TRUE)) %>%
  column_spec(5, image = spec_plot(sepal_length_list, polymin = 5))
Species boxplots histograms plots1 plots2
Setosa
Versicolor
Virginica


Contact

This document is a work by Yan Holtz. Any feedback is highly encouraged. You can fill an issue on Github, drop me a message on Twitter, or send an email pasting yan.holtz.data with gmail.com.

Github Twitter