Interactive Maps with leaflet in R


The leaflet package in R is a powerful tool for creating interactive maps. It provides a simple interface to the popular Leaflet JavaScript library, allowing R users to create sophisticated, interactive maps with ease.
This post explores the origins of leaflet, its key features, and provides a set of map examples using the package.

Documentation

{leaflet}

Quick start


The leaflet package in R is an interface to the Leaflet JavaScript library, one of the most popular open-source libraries for interactive maps.

It allows R users to create interactive maps with just a few lines of code, leveraging the power of Leaflet’s features.

✍️ authors → Joe Cheng, Bhaskar Karambelkar, Yihui Xie

📘 documentationDocumentation

⭐️ more than 800 stars on GitHub

Installation


To get started with leaflet, you can install it directly from CRAN using the install.packages function:

install.packages("leaflet")

Basic usage


The leaflet package uses a pipe-friendly structure to create maps. Here’s a basic example:

library(leaflet)

m <- leaflet() %>%
  addTiles() %>% # Add default OpenStreetMap map tiles
  addMarkers(lng = 174.768, lat = -36.852, popup = "The birthplace of R")
htmltools::save_html(m, file = "../HtmlWidget/leaflet-1.html")

Key features


→ Map Layers

In web mapping, layers represent various geographic data types. You can enhance your map’s functionality and appearance by adding different layers. Each layer can be tailored to your specific requirements, such as emphasizing certain features or data points.

To find suitable map layers, you can explore online tile providers to find the layers that suits you the best.

Here is an example using the OpenTopoMap that we add using the addProviderTiles() function:

library(leaflet)

m <- leaflet() %>%
  setView(lng = -71.0589, lat = 42.3601, zoom = 12) %>%
  addProviderTiles(providers$OpenTopoMap)
htmltools::save_html(m, file = "../HtmlWidget/leaflet-2.html")


→ Markers

Markers are used to pinpoint specific locations on a map, often with additional information such as labels or popups. They are useful for highlighting points of interest, such as cities, landmarks, or events.

In the following code:

  • addTiles(): Adds the default basemap tiles to the map.
  • addMarkers(): Places markers at the specified longitude and latitude coordinates.
    • lng and lat: Vectors specifying the longitude and latitude of the markers.
    • popup: A vector of strings that appear when the marker is clicked, providing additional information about each location.

Example of adding markers with Leaflet:

m <- leaflet() %>%
  addTiles() %>%
  addMarkers(
    lng = c(-118.2437, -74.0060), lat = c(34.0522, 40.7128),
    popup = c("Los Angeles, CA", "New York City, NY")
  )
htmltools::save_html(m, file = "../HtmlWidget/leaflet-3.html")


→ Customization

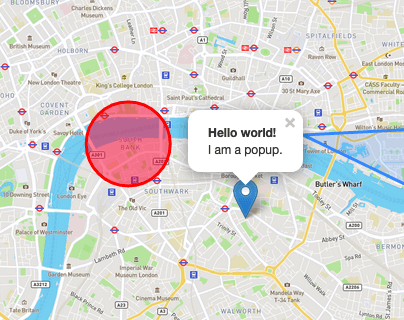
Because Leaflet is an HTML widget (it generates html code), you can easily add your own HTML/CSS code to your cards, allowing you to customise them as much as you like.

Title Styling:

  • The title variable defines HTML and CSS to style a title element.
  • The CSS class .custom-title sets the text color, shadow effects, and background with transparency. It also applies padding and rounded corners.
  • The hover effect changes the background color and reduces the shadow, creating an interactive visual effect.
  • The HTML <h1> tag within title displays the text “Boston” with the defined styling.

Legend Styling:

  • The legend variable contains HTML and CSS for a legend box.
  • The .custom-legend class styles the legend with a semi-transparent white background, padding, and a border. It also has rounded corners and a hover effect that slightly enlarges the box and changes its background color.
  • The HTML within legend includes a paragraph with a link to Wikipedia about Boston and a brief description of the city.
library(leaflet)
library(htmltools)

# Define HTML with advanced CSS styling
title <- "
<style>
  .custom-title {
    color: #34495e;
    text-shadow: 2px 2px 4px rgba(0, 0, 0, 0.2);
    box-shadow: 0 4px 8px rgba(0, 0, 0, 0.5);
    background-color: rgba(204, 224, 255, 0.9);
    padding: 12px;
    border-radius: 8px;
    transition: background-color 0.3s, box-shadow 0.3s;
}
.custom-title:hover {
    background-color: rgba(204, 224, 255, 0.7);
    box-shadow: 0 4px 8px rgba(0, 0, 0, 0.3);
}
</style>
<h1>
  Bostom
</h1>"

legend <- "
<style>
  .custom-legend {
    background-color: rgba(255, 255, 255, 0.8);
    padding: 10px;
    border-radius: 5px;
    border: 1px solid #ddd;
    transition: background-color 0.3s, transform 0.3s;
    width: 300px;
  }
  .custom-legend:hover {
    background-color: rgba(255, 255, 255, 0.9);
    transform: scale(1.05);
  }
</style>
<div>
 <p>
     <a href='https://en.wikipedia.org/wiki/Boston' target='_blank'>Boston</a> is the capital city of Massachusetts and a major city in the northeastern United States. It's known for its rich history, being a center of the American Revolution, and its significant contributions to education, with institutions like Harvard University and MIT. It also has a prominent role in finance, technology, and healthcare.
  </p>
</div>"

# Create the map
m <- leaflet() %>%
  addTiles() %>%
  addProviderTiles(providers$OpenTopoMap) %>%
  setView(lng = -71.0589, lat = 42.3601, zoom = 12) %>%
  addControl(html = title, position = "topright", className = "custom-title") %>%
  addControl(html = legend, position = "bottomleft", className = "custom-legend") %>%
  addPopups(lng = -71.0589, lat = 42.3601, popup = "Boston", options = popupOptions(closeButton = FALSE))

# Save the map
htmltools::save_html(m, file = "../HtmlWidget/leaflet-4.html")


❤️ 10 best R tricks ❤️

👋 After crafting hundreds of R charts over 12 years, I've distilled my top 10 tips and tricks. Receive them via email! One insight per day for the next 10 days! 🔥