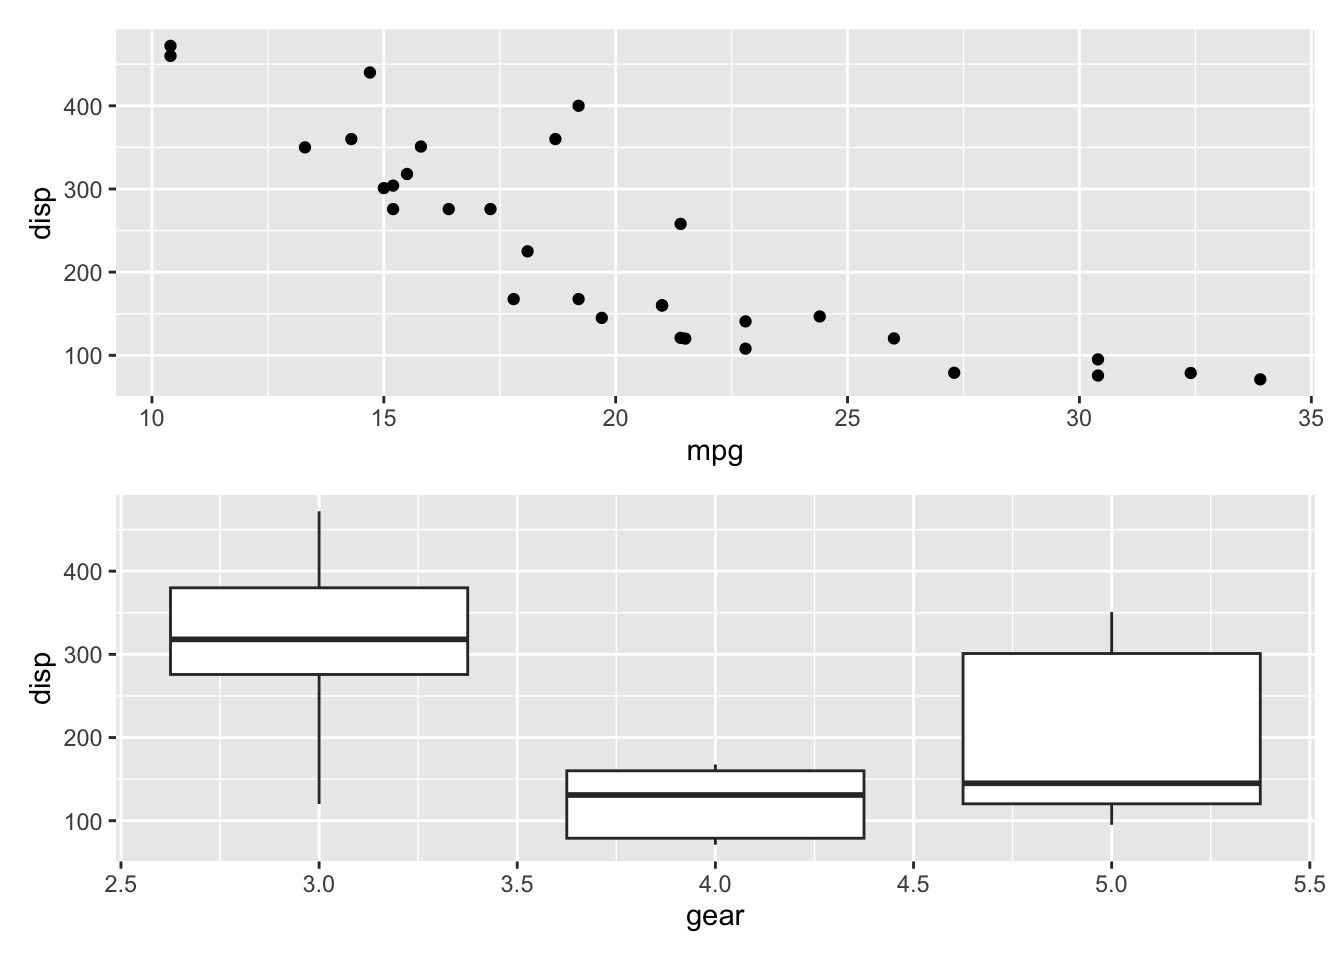
The patchwork package in R is
an extension of the ggplot2
package, designed to simplify the process of combining multiple
plots into a single layout.
This post showcases the
key features of patchwork and provides a
set of graph examples using the package.
 
                {patchwork}
The patchwork package in R is an extension of the ggplot2
package, designed to simplify the process of combining multiple
plots into a single layout.
It offers a set of operators that make it easy to specify complex layouts in a human-readable way.
✍️ author → Thomas Lin Pedersen
📘 documentation → github
⭐️ more than 1000 stars on github

To get started with patchwork, you can install it
directly from CRAN using the install.packages function:
The patchwork package allows you to combine multiple
plots using simple arithmetic operators like
+, /, and |.
Here’s a basic example:
p1 <- ggplot(mtcars) + geom_point(aes(mpg, disp))
p2 <- ggplot(mtcars) + geom_boxplot(aes(gear, disp, group = gear))
p1 + p2
👋 After crafting hundreds of R charts over 12 years, I've distilled my top 10 tips and tricks. Receive them via email! One insight per day for the next 10 days! 🔥