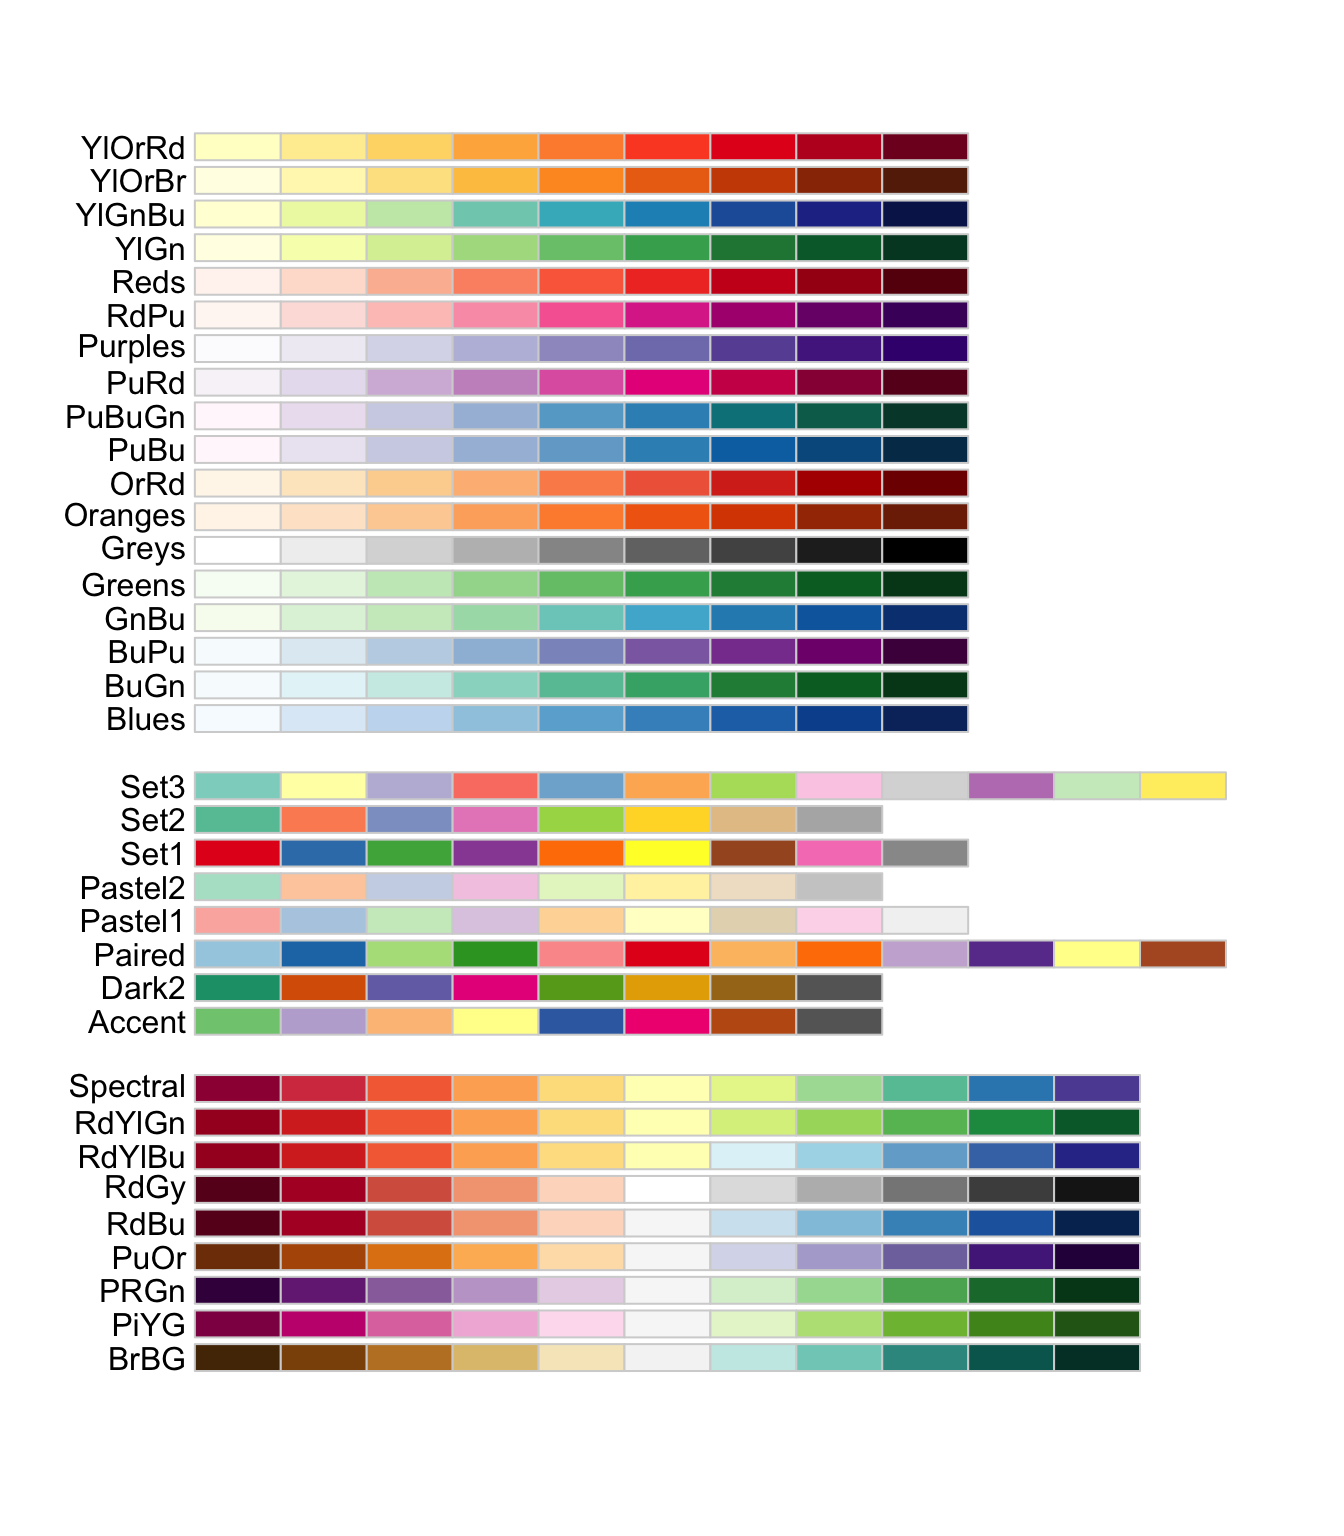
Access mutliple color palettes with RColorBrewer


When working with colors in R, the 
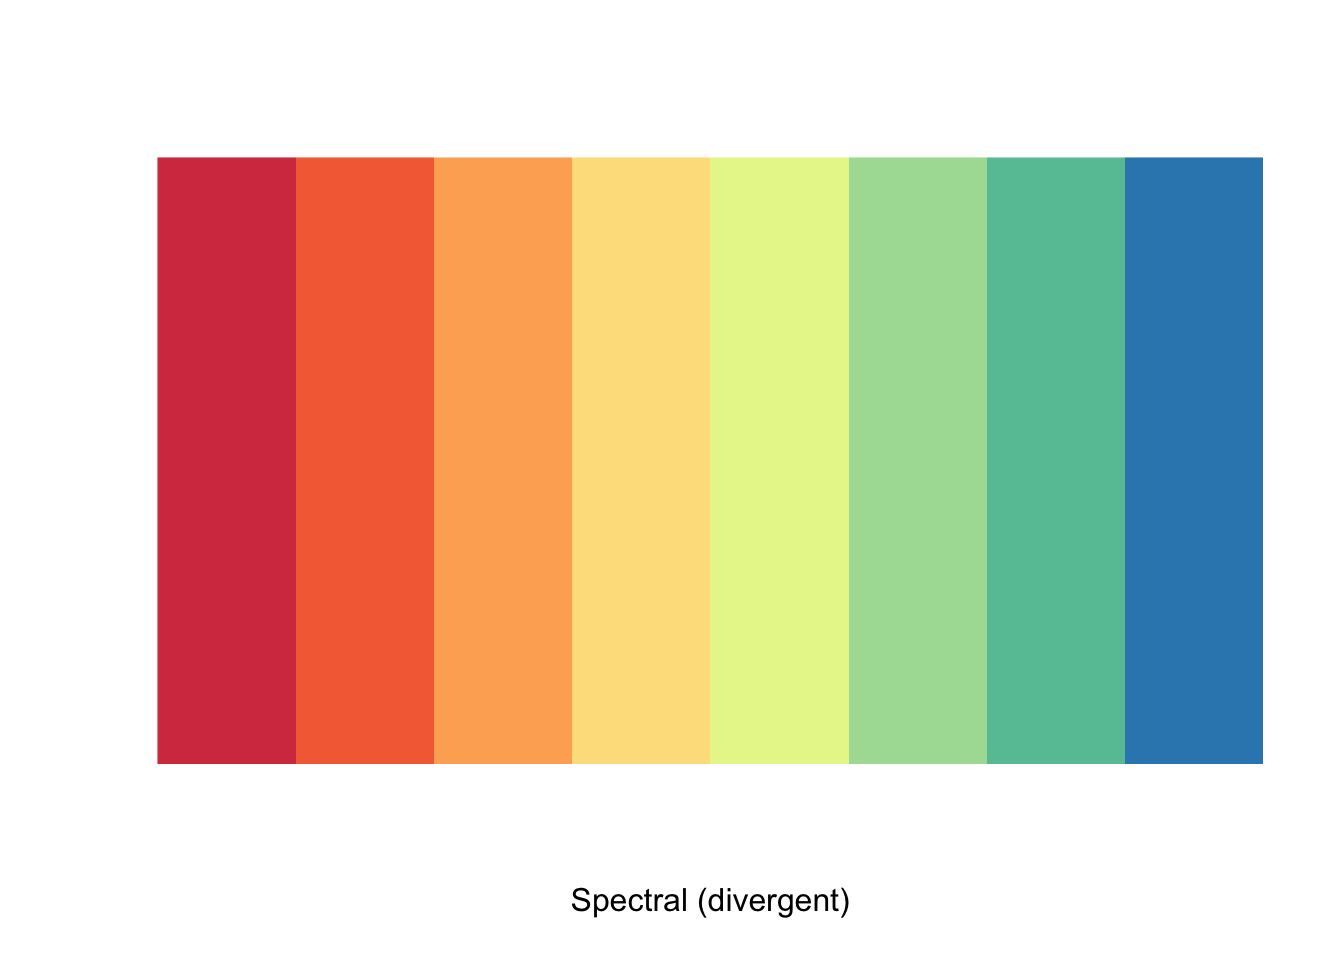
RColorBrewer package is indispensable. It provides a variety of color palettes, showcased in the attached figure. This page is designed solely to display the composition of each palette, while detailed usage instructions are available on other pages.

Documentation

{RColorBrewer}

Quick start


The RColorBrewer package in R is an extension of the ggplot2 package, designed to simplify the process of combining multiple plots into a single layout.

The library provides a variety of color palettes that can be used to customize the appearance of your plots. The figure below showcases all the palettes available in the package.

✍️ author → Erich Neuwirth

📘 documentationCRAN

all rcolorbrewer palettes

Installation


To get started with RColorBrewer, you can install it directly from CRAN using the install.packages function:

install.packages("RColorBrewer")

Basic usage


There are 3 types of palettes :

library(RColorBrewer)
colors = brewer.pal(n = 8, name = "PuOr")

# basic plot
library(ggplot2)
ggplot(mtcars, aes(x = wt, y = mpg, color = factor(cyl))) +
  geom_point(size = 3) +
  scale_color_manual(values = colors) +
  theme_minimal()

Key features


→ Get hex codes

Thanks to the brewer.pal() function, you can easily get the hex codes of a palette.

Example:

library(RColorBrewer)
brewer.pal(n = 8, name = "Spectral")
## [1] "#D53E4F" "#F46D43" "#FDAE61" "#FEE08B" "#E6F598" "#ABDDA4" "#66C2A5"
## [8] "#3288BD"


→ Display a palette

The display.brewer.pal() function allows you to visualize a palette.

Example:

library(RColorBrewer)
display.brewer.pal(n = 8, name = "Spectral")


→ Use in ggplot2

Since RColorBrewer is an extension of ggplot2, you can use it to customize the color of your plots.

Here are 3 examples that use 1 sequential palette, 1 diverging palette, and 1 qualitative palette:

library(RColorBrewer)
colors_seq = brewer.pal(n = 8, name = "Blues")
colors_div = brewer.pal(n = 8, name = "RdYlBu")
colors_qual = brewer.pal(n = 8, name = "Set3")

# basic plot
library(ggplot2)
ggplot(mtcars, aes(x = wt, y = mpg, color = factor(cyl))) +
  geom_point(size = 3) +
  scale_color_manual(values = colors_seq) +
  theme_minimal()

ggplot(mtcars, aes(x = wt, y = mpg, color = factor(cyl))) +
  geom_point(size = 3) +
  scale_color_manual(values = colors_div) +
  theme_minimal()

ggplot(mtcars, aes(x = wt, y = mpg, color = factor(cyl))) +
  geom_point(size = 3) +
  scale_color_manual(values = colors_qual) +
  theme_minimal()


❤️ 10 best R tricks ❤️

👋 After crafting hundreds of R charts over 12 years, I've distilled my top 10 tips and tricks. Receive them via email! One insight per day for the next 10 days! 🔥