Create interactive table with reactable


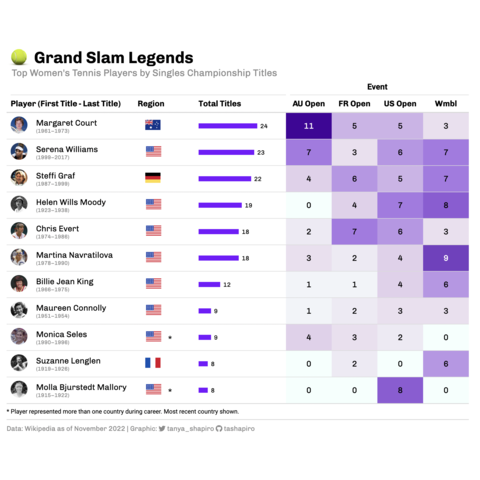
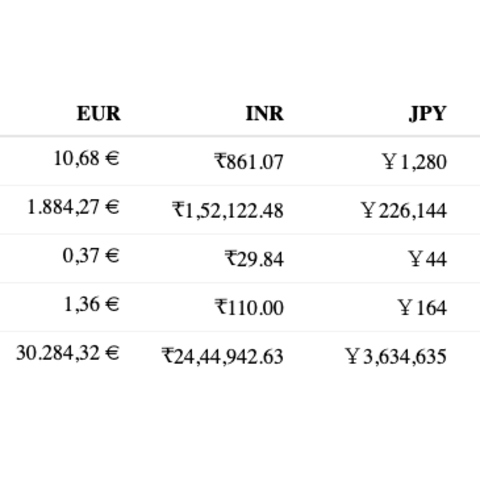
The reactable package in R is designed to simplify the process of creating interactive tables.
This post showcases the key features of reactable and provides a set of table examples using the package.
Documentation

{reactable}

Quick start


The reactable package in R is a powerful and flexible tool for creating interactive and customizable tables in web applications and R Shiny dashboards.

It mainly provides one function: reactable() allowing to create a table from a data frame.

✍️ author → Greg Lin

📘 documentationgithub

⭐️ more than 500 stars on github

This is how a default reactable table looks like:

Installation


To get started with reactable, you can install it directly from CRAN using the install.packages function:

install.packages("reactable")

Basic usage


The reactable package provides one main function: reactable(). It takes a data frame as input and returns an interactive table.

This is how the table above was produced:

table <- reactable(mtcars,
  defaultColDef = colDef(
    minWidth = 100,
    width = 150,
    style = list(padding = "0 10px"), html = TRUE
  )
)
# table

# save widget
# library(htmltools)
# saveWidget(table, file="../HtmlWidget/reactable1.html")

Key features


→ Searching

You can enable searching by setting the searchable argument to TRUE.

Example:

table <- reactable(mtcars, searchable = TRUE)
table
# save widget
# library(htmltools)
# saveWidget(table, file="../HtmlWidget/reactable2.html")

→ Filtering

You can enable filtering by setting the filterable argument to TRUE.

Example:

table <- reactable(mtcars, filterable = TRUE, minRows = 10)
table
# save widget
# library(htmltools)
# saveWidget(table, file="../HtmlWidget/reactable3.html")

→ Grouping and Aggregating

You can enable grouping and aggregating by setting the groupBy argument to the name of a column and by adding the aggregate argument in each column definition.

Example:

table <- reactable(iris,
  groupBy = "Species", # Group by the Species column
  columns = list(
    Sepal.Length = colDef(aggregate = "max"), # max value
    Sepal.Width = colDef(aggregate = "mean", format = colFormat(digits = 1)), # mean value
    Petal.Length = colDef(aggregate = "unique"), # unique values
    Petal.Width = colDef(aggregate = "min") # min value
  )
)
table
# save widget
# library(htmltools)
# saveWidget(table, file="../HtmlWidget/reactable4.html")

→ Theming

You can customize the appearance of the table by setting the theme argument to a reactableTheme object. You can also use the striped or highlight arguments to add stripes or highlight the hovered row.

Example:

table <- reactable(
  iris[1:30, ],
  striped = TRUE,
  highlight = TRUE,
  theme = reactableTheme(
    borderColor = "#dfe2e5",
    stripedColor = "#f6f8fa",
    highlightColor = "red",
    cellPadding = "8px 12px",
    style = list(fontFamily = "-apple-system, BlinkMacSystemFont, Segoe UI, Helvetica, Arial, sans-serif"),
    searchInputStyle = list(width = "100%")
  ))
table
# save widget
# library(htmltools)
# saveWidget(table, file="../HtmlWidget/reactable5.html")


❤️ 10 best R tricks ❤️

👋 After crafting hundreds of R charts over 12 years, I've distilled my top 10 tips and tricks. Receive them via email! One insight per day for the next 10 days! 🔥