About shapefiles
If you did not find the geospatial data you need in existing R packages (see the map section), you need to find this information elsewhere on the web.
Usually, you will find it as a shape file format. This format is composed by several files that you need to keep together in the same folder.
Find and download a shapefile.
You need to dig the internet to find the shape file you are interested in. For instance, this URL will redirect you to a zipped shape file containing the world boundaries.
You can download it and unzip it with R:
# Download the shapefile. (note that I store it in a folder called DATA. You have to change that if needed.)
download.file("http://thematicmapping.org/downloads/TM_WORLD_BORDERS_SIMPL-0.3.zip", destfile = "DATA/world_shape_file.zip")
# You now have it in your current working directory, have a look!

# Unzip this file. You can do it with R (as below), or clicking on the object you downloaded.
unzip("DATA/world_shape_file.zip", junkpaths = FALSE)
#  -- > You now have 4 files. One of these files is a .shp file! (TM_WORLD_BORDERS_SIMPL-0.3.shp)
Read it with sf
The sf package offers the st_read() and the
read_sf() functions that allows to
read shapefile using the following syntax.
As a result you get a geospatial object (my_sf here) that
contains all the information we need for further mapping. Please try
the following command to understand how this object works:
-
print(my_sf): tells you the max and min coordinates, the kind of projection in use and the the first few rows of the data associated with the regions. nrow(my_sf): how many regions you have
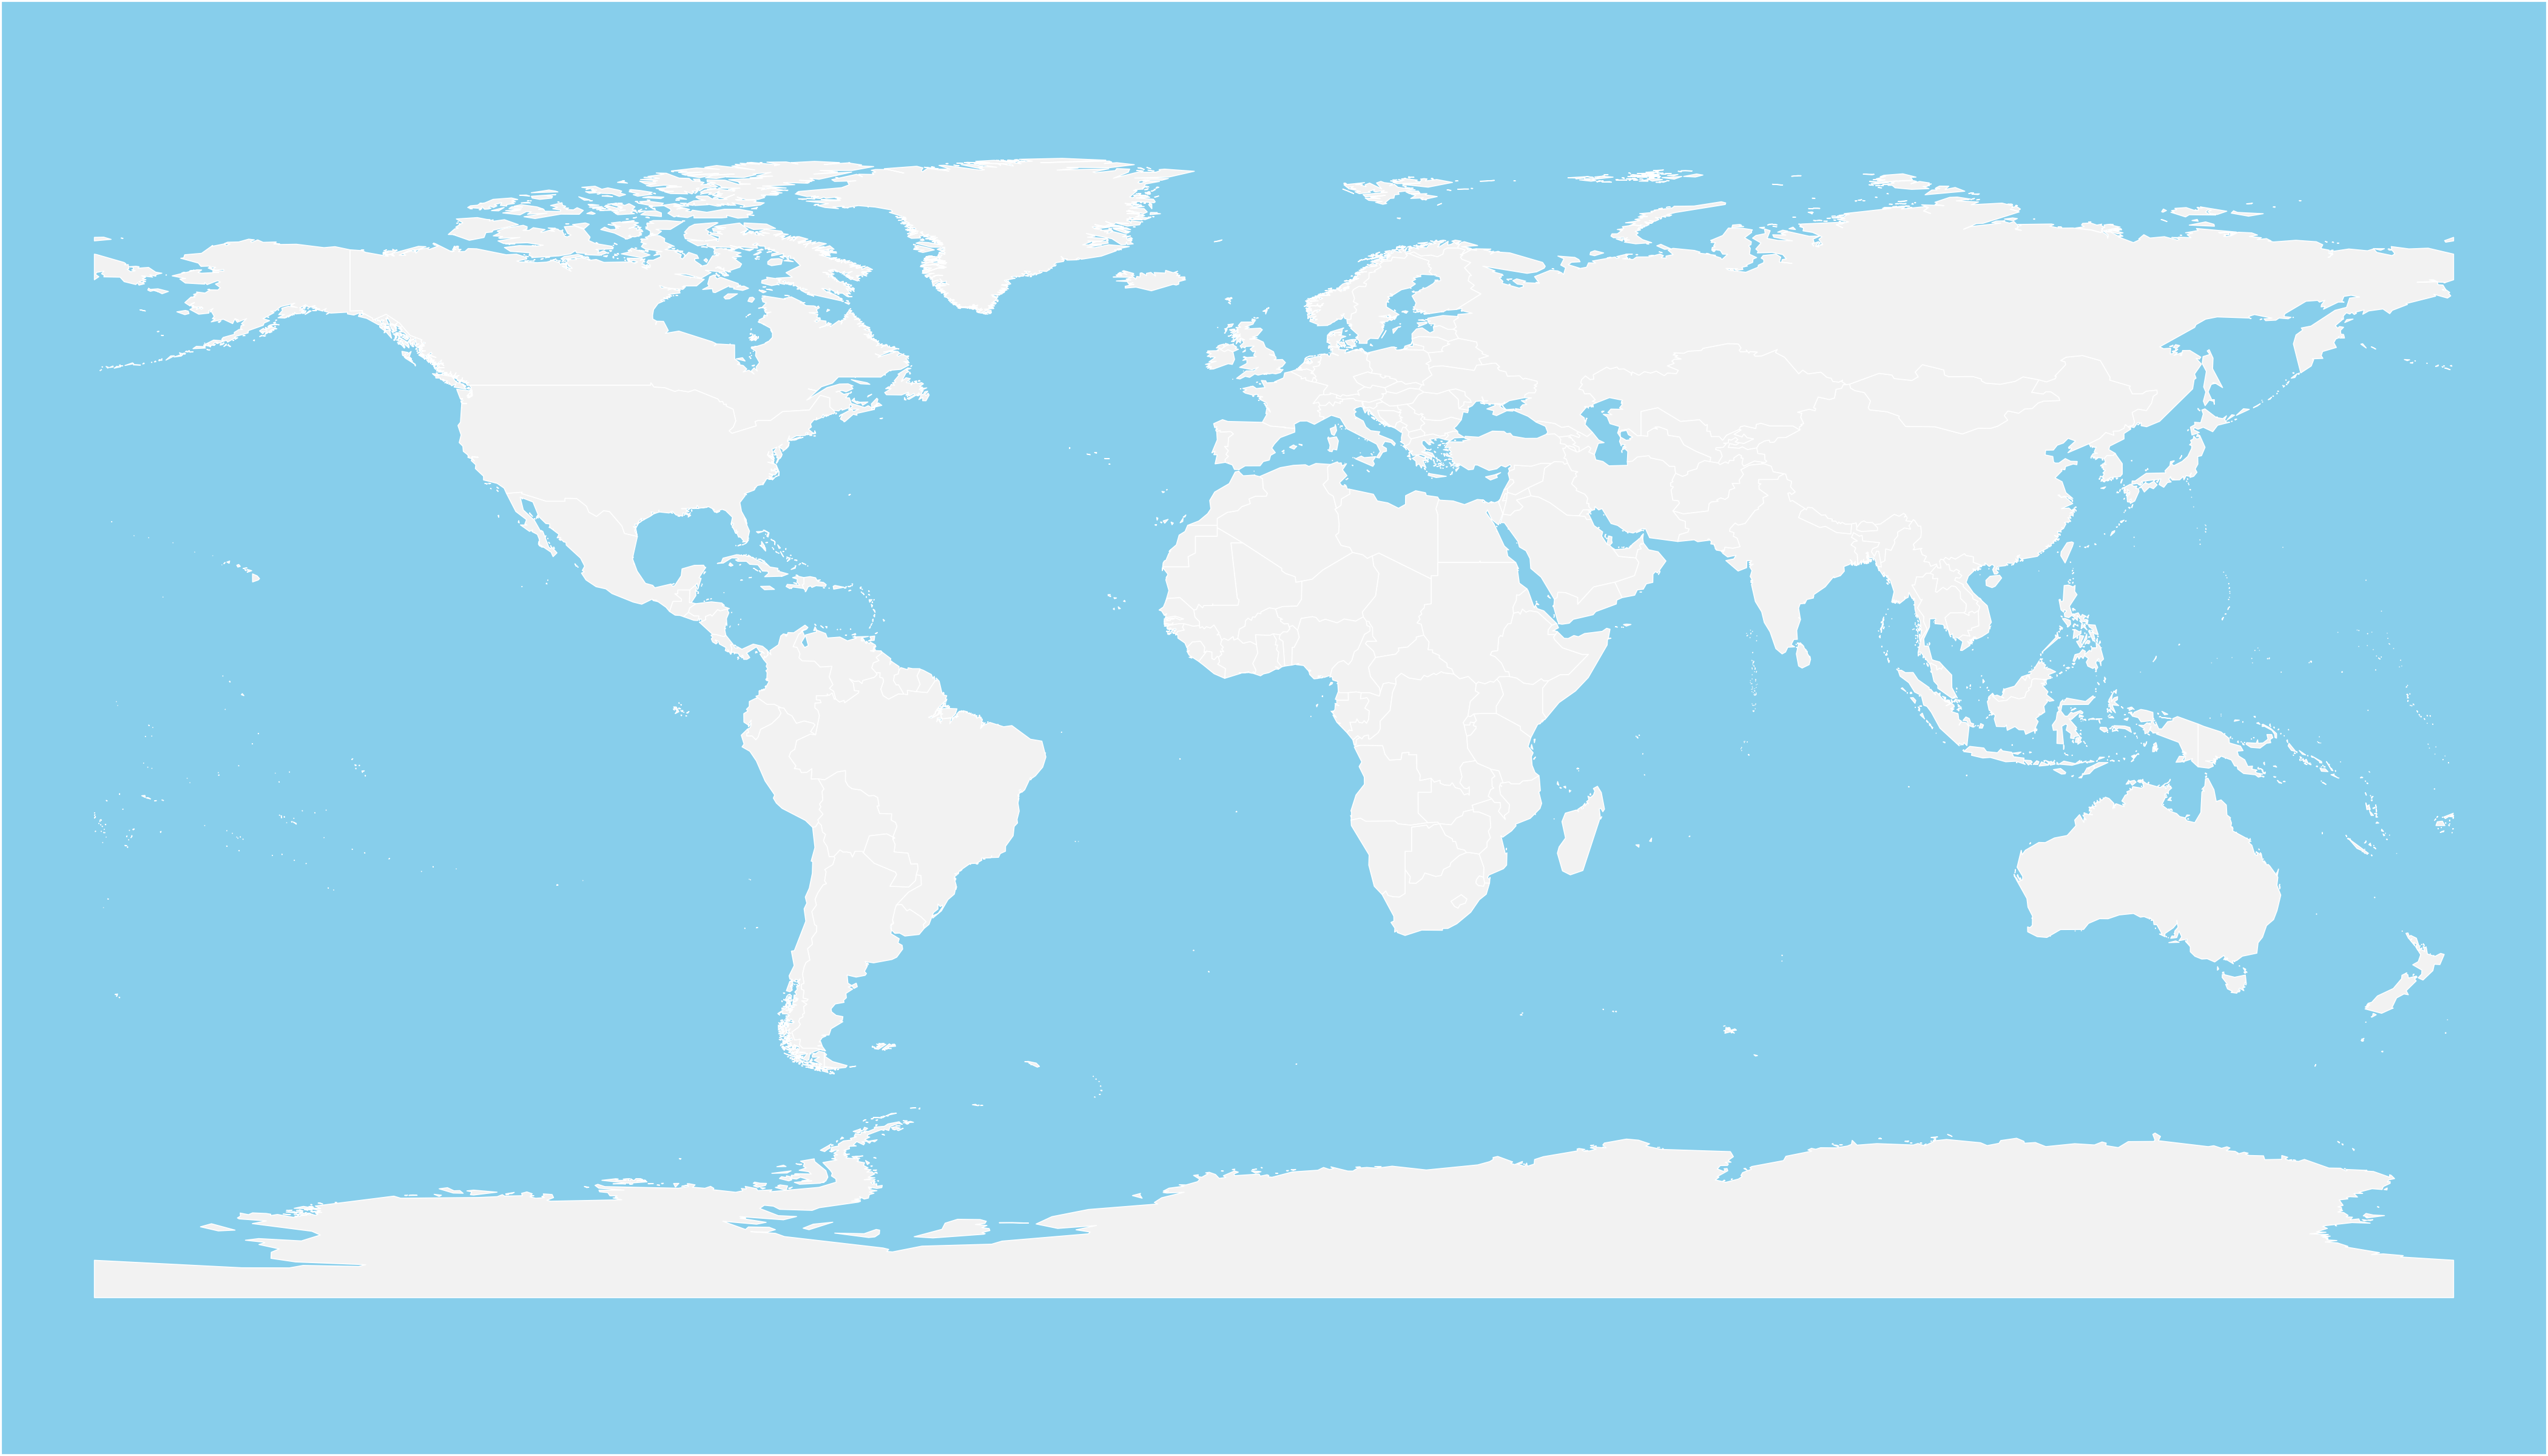
Plot it with base R
The basic plot() function knows how to plot a
geospatial object. Thus you just need to pass it
my_sf and add a couple of options to customize the
output.
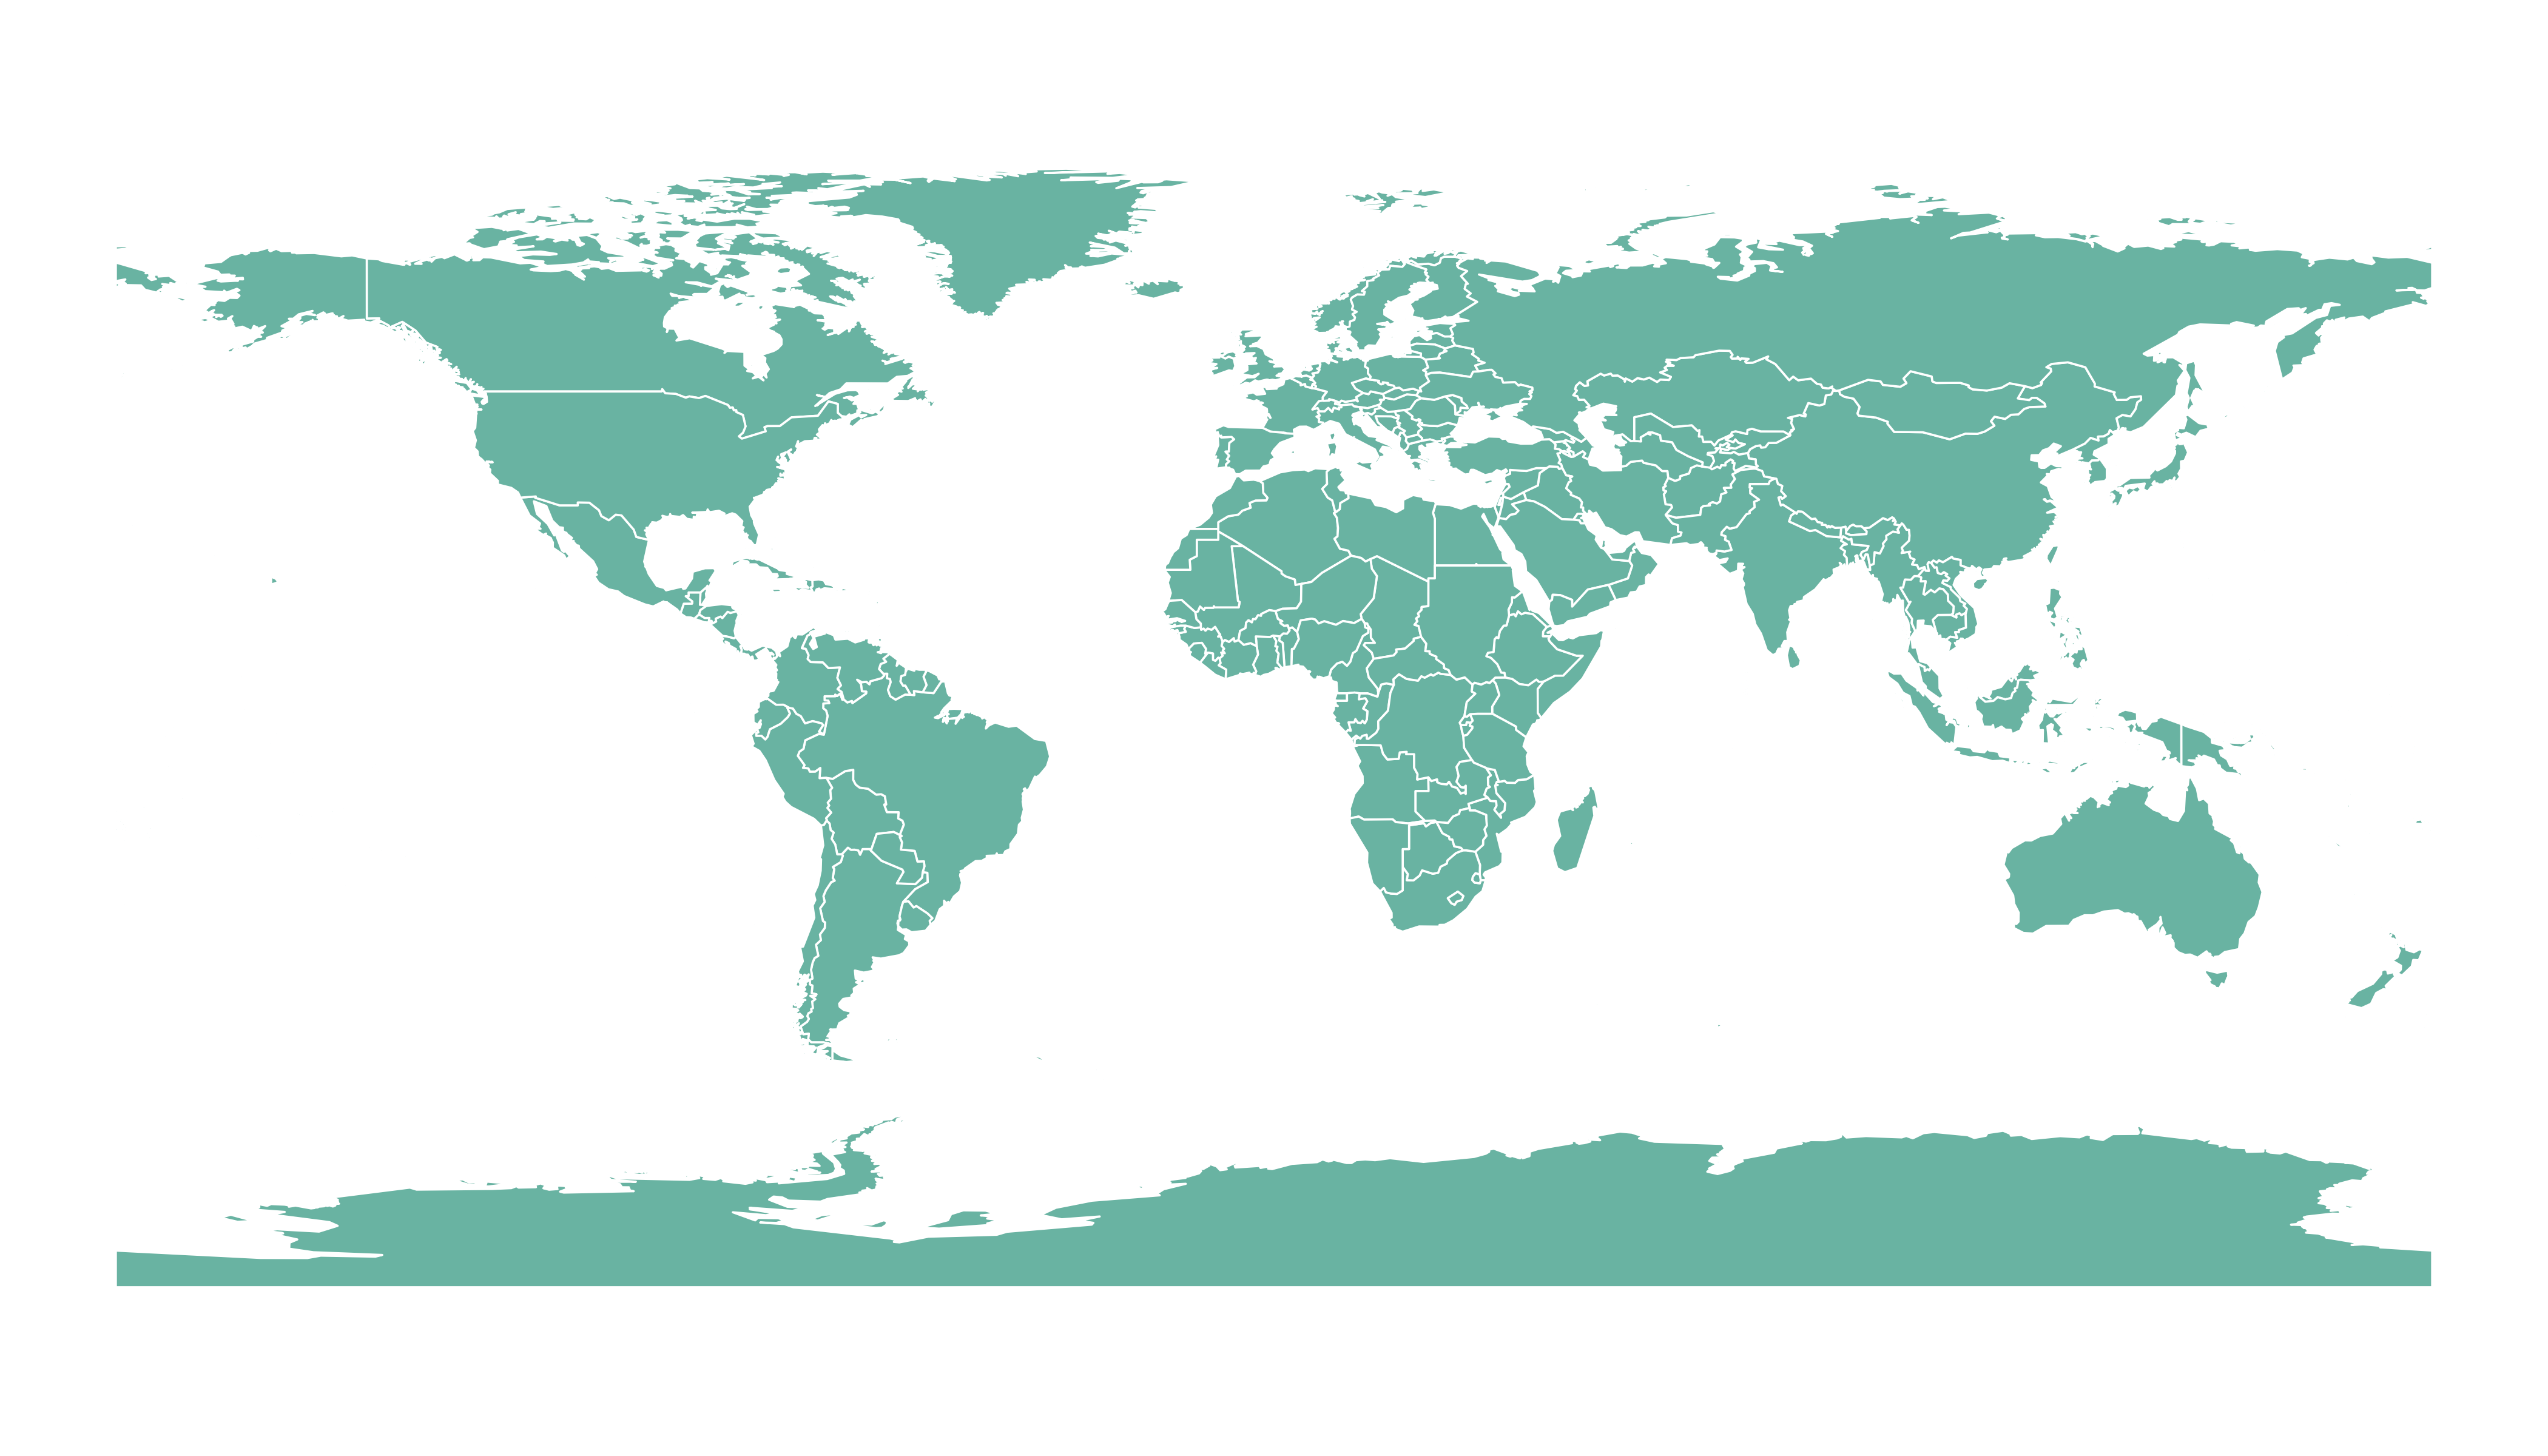
Plot it with ggplot2
It is totally possible (and advised) to build the map with
ggplot2, using the
geom_sf() function as described below.
Going further
This post explains how to read and plot a shapefile in R.
You might be interested in how to customize the map (select regions, change colors, etc.) and more generally in the map section.