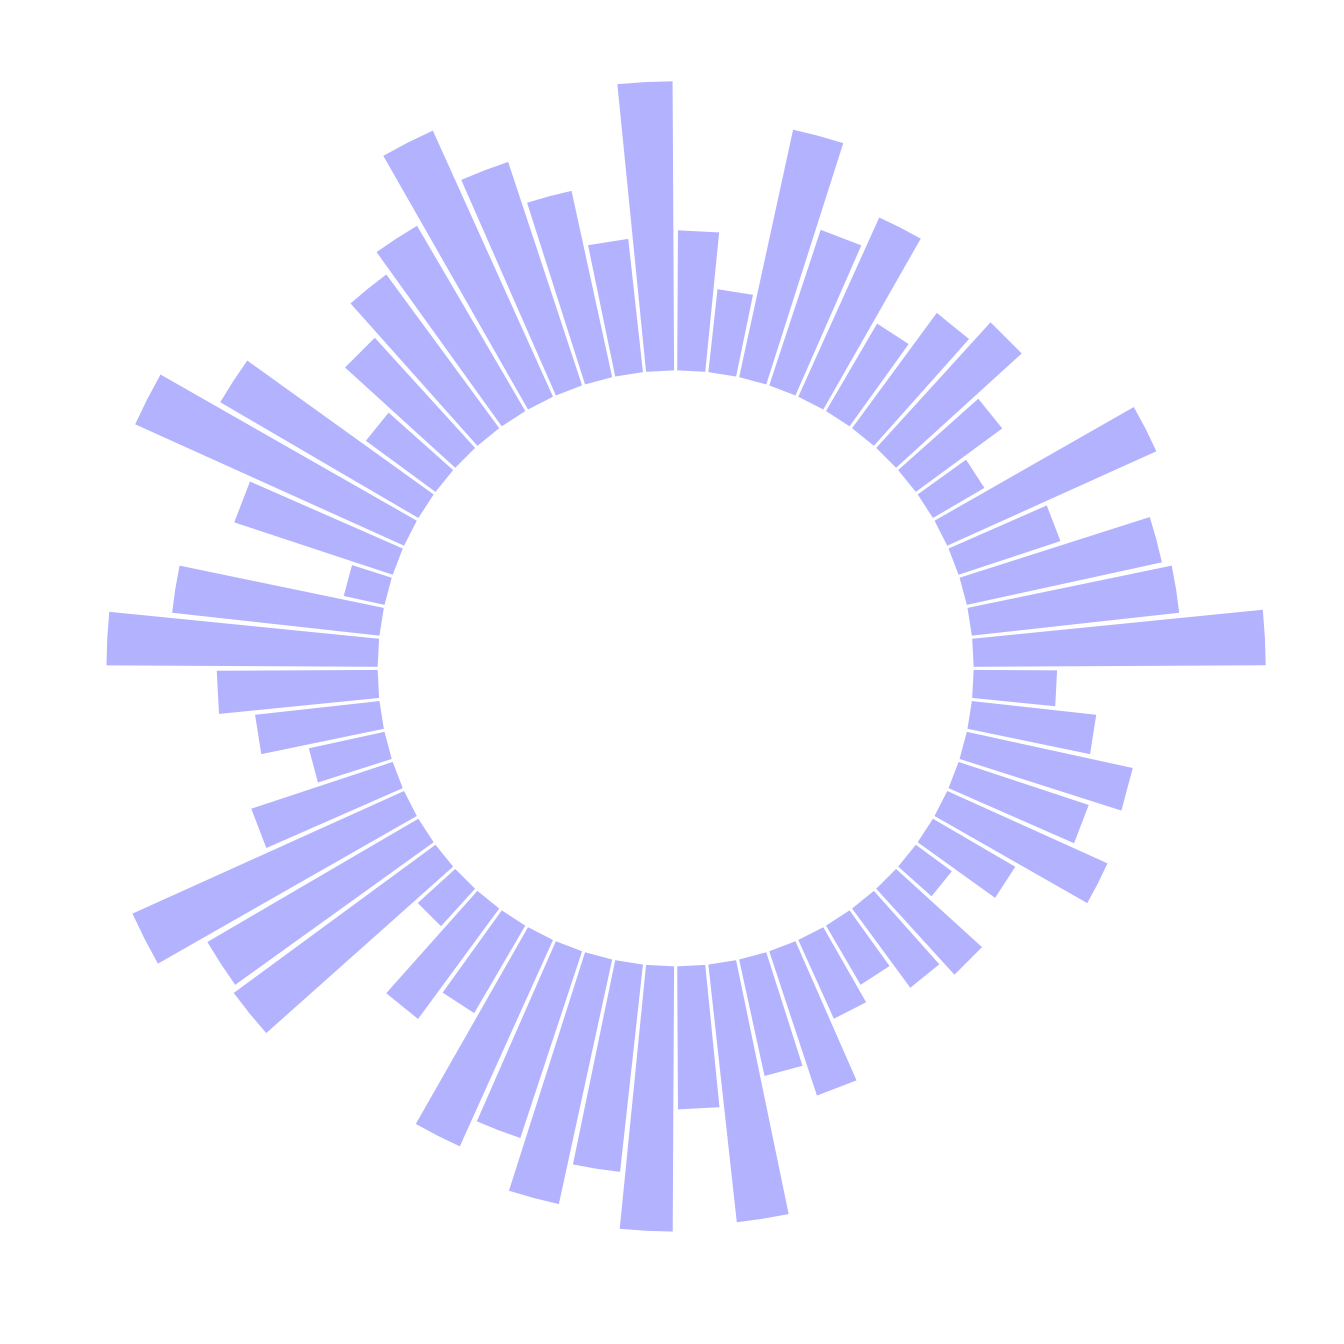
A circular barplot is a barplot where bars are displayed along a circle instead of a line.
The input dataset is the same than for a barplot: we need one numeric value per group (one group = one bar). (See more explanation in the barplot section).
Basically, the method is the same than to do a classic barplot. At
the end, we call coord_polar() to make the chart
circular. Note that the ylim() argument is really
important. If it starts at 0, the bars will start from the centre of
the circle. If you provide a negative value, a white circle space
will appear!
This chart is not really insightful, go to the next example to learn how to add labels!
# Libraries
library(tidyverse)

# Create dataset
data <- data.frame(
  id=seq(1,60),
  individual=paste( "Mister ", seq(1,60), sep=""),
  value=sample( seq(10,100), 60, replace=T)
)

# Make the plot
p <- ggplot(data, aes(x=as.factor(id), y=value)) +       # Note that id is a factor. If x is numeric, there is some space between the first bar

  # This add the bars with a blue color
  geom_bar(stat="identity", fill=alpha("blue", 0.3)) +

  # Limits of the plot = very important. The negative value controls the size of the inner circle, the positive one is useful to add size over each bar
  ylim(-100,120) +

  # Custom the theme: no axis title and no cartesian grid
  theme_minimal() +
  theme(
    axis.text = element_blank(),
    axis.title = element_blank(),
    panel.grid = element_blank(),
    plot.margin = unit(rep(-2,4), "cm")     # This remove unnecessary margin around plot
  ) +

  # This makes the coordinate polar instead of cartesian.
  coord_polar(start = 0)
p
What’s next?
This chart is not really insightful, go to the next example to learn how to add labels!


