Using RColorBrewer from base R.


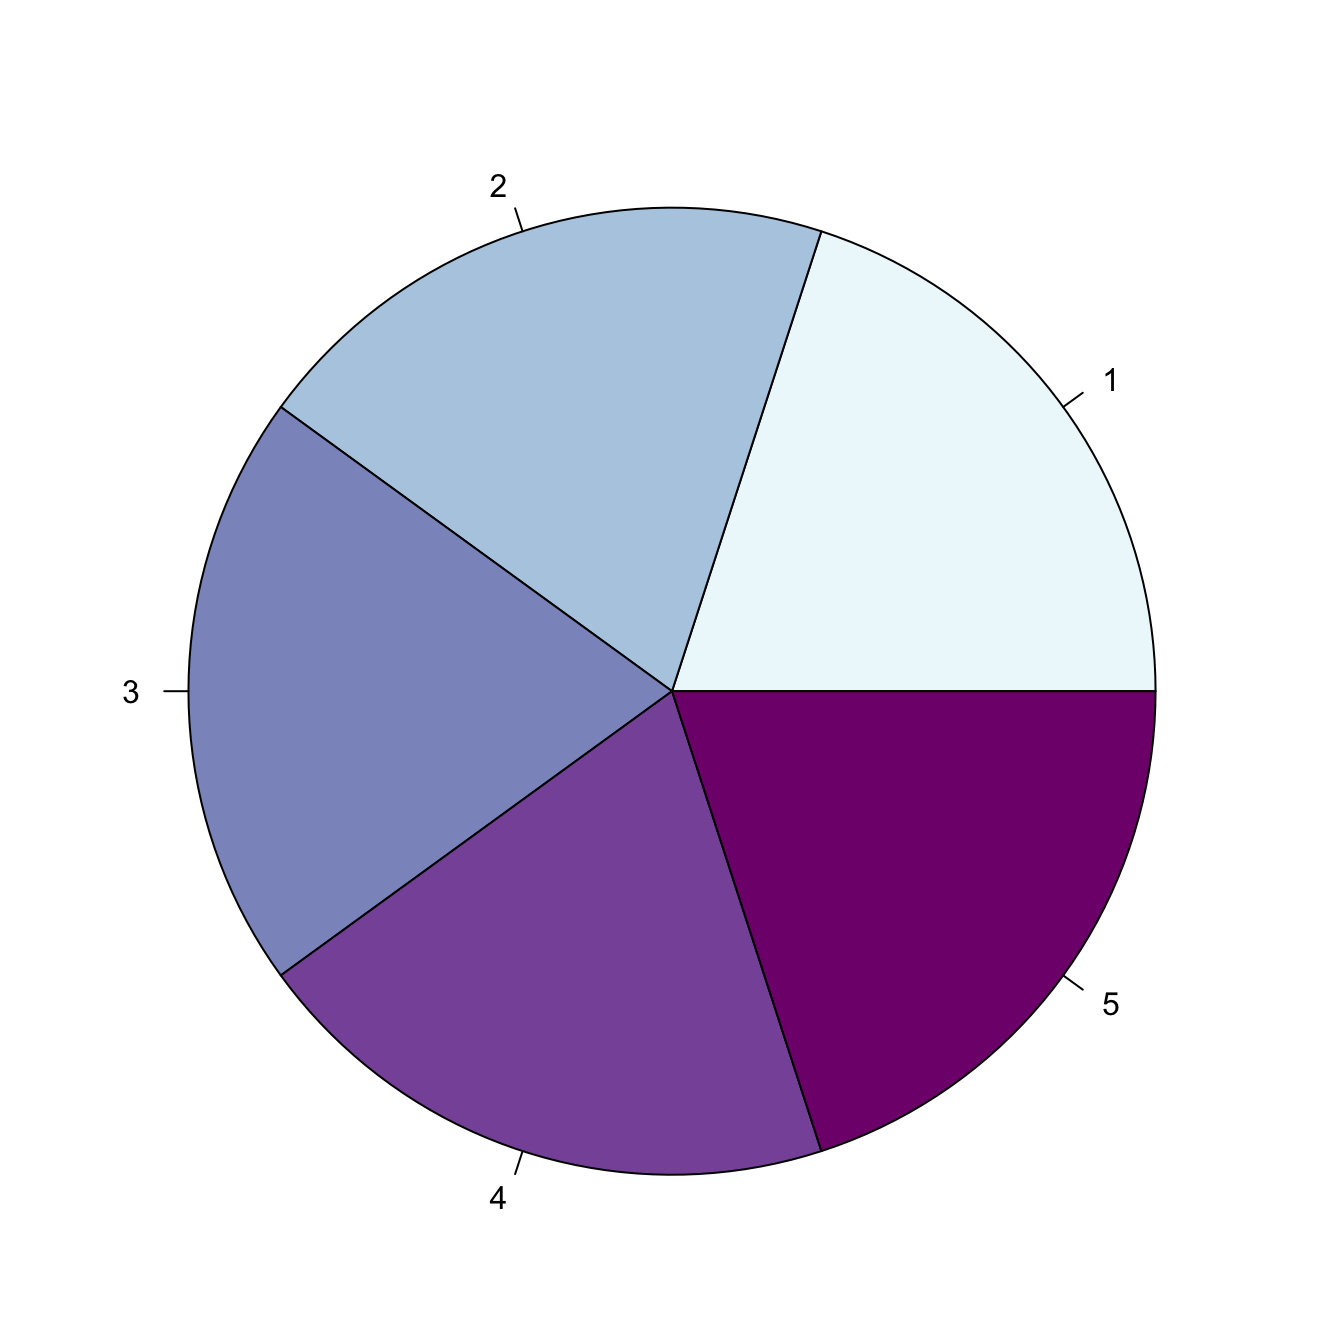
This post shows how to build a palette with RColorBrewer and use it in a base R chart.

Base R color Section About line chart

The RColorBrewer package offers about 25 different color palettes for R. To build a color palette using it, use the brewer.pal() function.

Note: if you need more than 7 colors, read this post.

Note: visit this post for a complete list of the available palettes.


# No margin
par(mar=c(0,0,1,0))

# Load RColorBrewer
library(RColorBrewer)

# Build a color palette, 5 colors coming from the BuPu color palette"
coul <- brewer.pal(5, "BuPu") 

# Build a pie chart with it
pie(rep(1, length(coul)), col = coul , main="") 

Related chart types


Ggplot2
Animation
Interactivity
3D
Caveats
Data art


Contact

This document is a work by Yan Holtz. Any feedback is highly encouraged. You can fill an issue on Github, drop me a message on Twitter, or send an email pasting yan.holtz.data with gmail.com.

Github Twitter