If you’re not convinced about that danger of using basic boxplot, please read this post that explains it in depth.
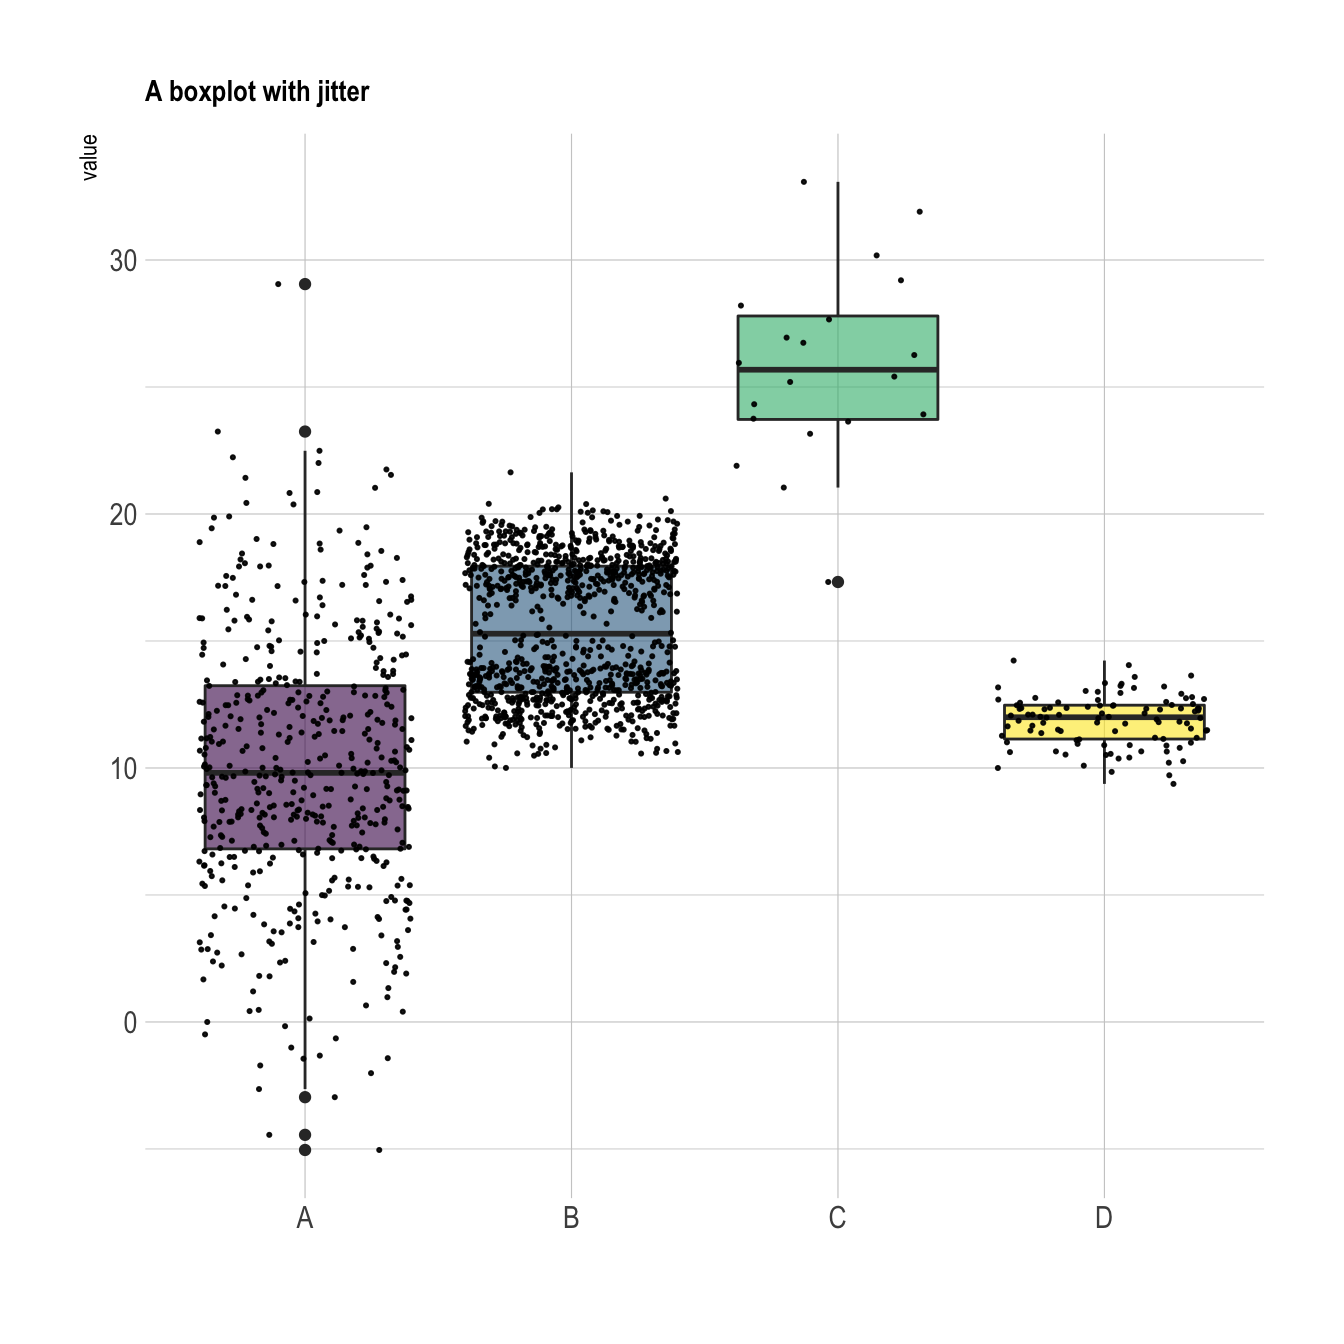
Fortunately, ggplot2 makes it a
breeze to add invdividual observation on top of boxes thanks to the
geom_jitter() function. This function shifts all dots
by a random value ranging from 0 to size, avoiding
overlaps.
Now, do you see the bimodal distribution hidden behind group B?
# Libraries
library(tidyverse)
library(hrbrthemes)
library(viridis)

# create a dataset
data <- data.frame(
  name=c( rep("A",500), rep("B",500), rep("B",500), rep("C",20), rep('D', 100)  ),
  value=c( rnorm(500, 10, 5), rnorm(500, 13, 1), rnorm(500, 18, 1), rnorm(20, 25, 4), rnorm(100, 12, 1) )
)

# Plot
data %>%
  ggplot( aes(x=name, y=value, fill=name)) +
    geom_boxplot() +
    scale_fill_viridis(discrete = TRUE, alpha=0.6) +
    geom_jitter(color="black", size=0.4, alpha=0.9) +
    theme_ipsum() +
    theme(
      legend.position="none",
      plot.title = element_text(size=11)
    ) +
    ggtitle("A boxplot with jitter") +
    xlab("")
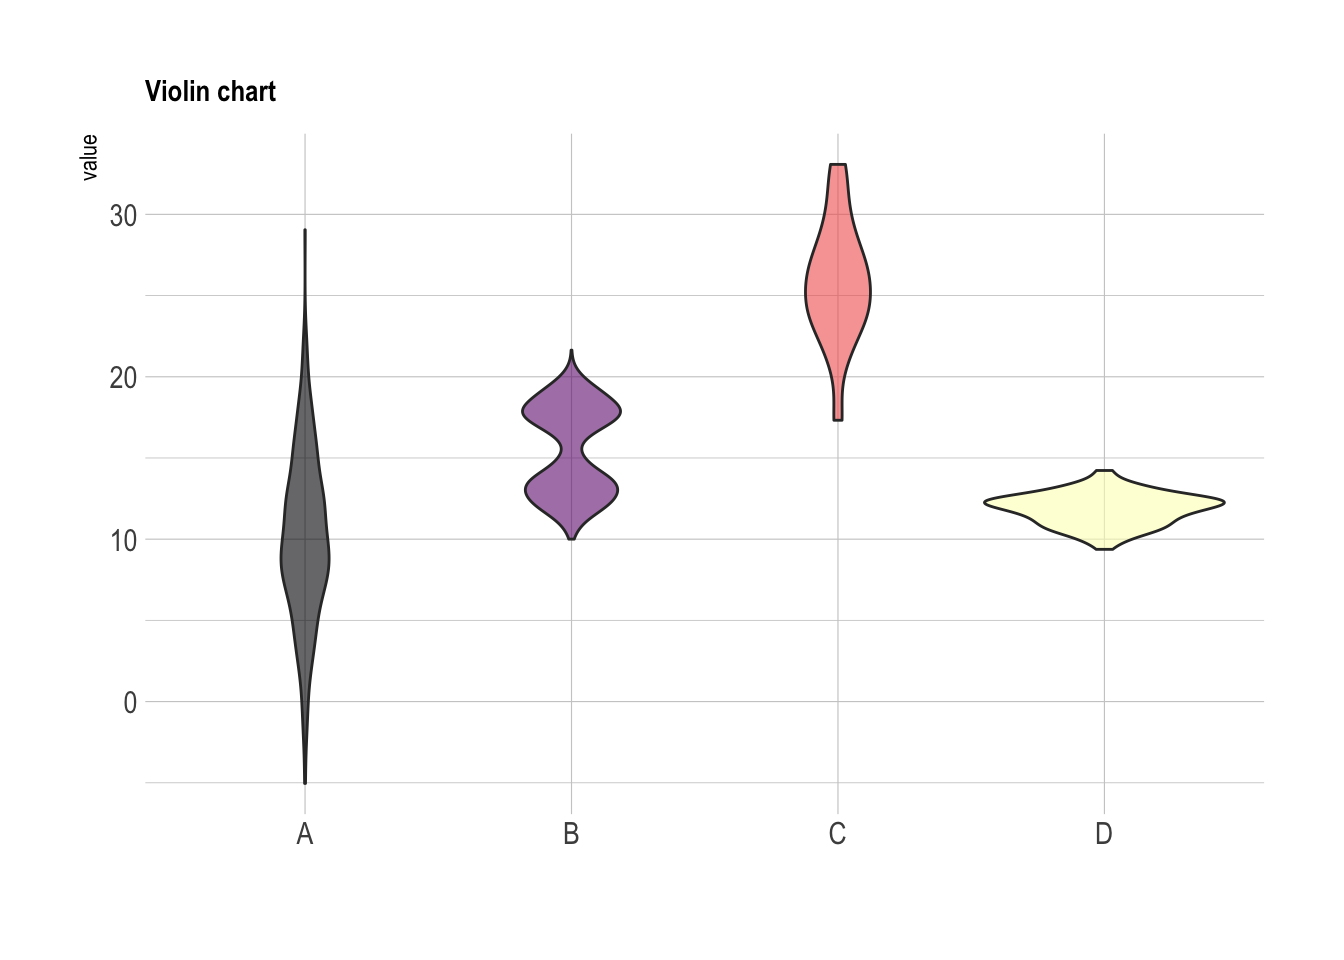
In case you’re not convinced, here is how the basic
boxplot and the basic
violin plot look like:
# Boxplot basic
data %>%
  ggplot( aes(x=name, y=value, fill=name)) +
    geom_boxplot() +
    scale_fill_viridis(discrete = TRUE, alpha=0.6, option="A") +
    theme_ipsum() +
    theme(
      legend.position="none",
      plot.title = element_text(size=11)
    ) +
    ggtitle("Basic boxplot") +
    xlab("")

# Violin basic
data %>%
  ggplot( aes(x=name, y=value, fill=name)) +
    geom_violin() +
    scale_fill_viridis(discrete = TRUE, alpha=0.6, option="A") +
    theme_ipsum() +
    theme(
      legend.position="none",
      plot.title = element_text(size=11)
    ) +
    ggtitle("Violin chart") +
    xlab("")