The ggplot2 package recognizes the
date format and automatically uses a specific type of X
axis. If the time variable isn’t at the date format,
this won’t work. Always check with str(data) how
variables are understood by R. If not read as a date, use
lubridate to convert it. Read more
about this here.
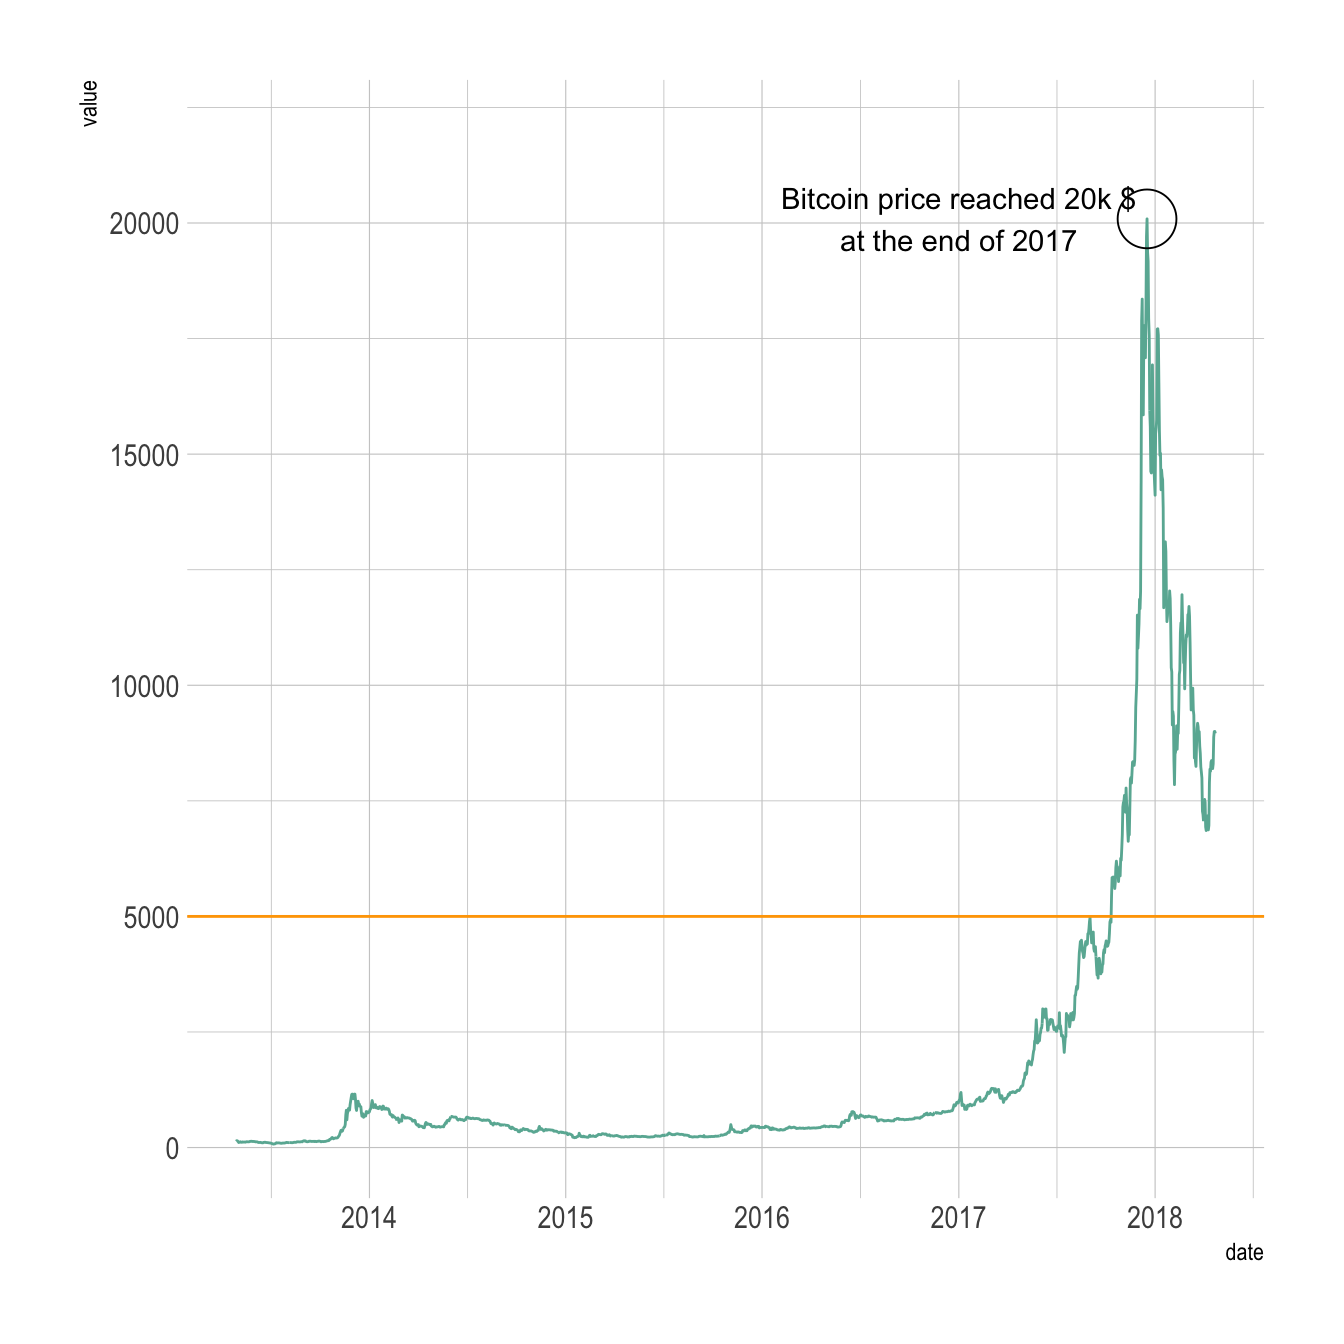
On the chart beside, dates are displayed using a neat format: month + year.
Note: the gallery offers a section dedicated to line charts.
# Libraries
library(ggplot2)
library(dplyr)
library(plotly)
library(hrbrthemes)

# Load dataset from github
data <- read.table("https://raw.githubusercontent.com/holtzy/data_to_viz/master/Example_dataset/3_TwoNumOrdered.csv", header=T)
data$date <- as.Date(data$date)

# plot
data %>%
  ggplot( aes(x=date, y=value)) +
    geom_line(color="#69b3a2") +
    ylim(0,22000) +
    annotate(geom="text", x=as.Date("2017-01-01"), y=20089,
             label="Bitcoin price reached 20k $\nat the end of 2017") +
    annotate(geom="point", x=as.Date("2017-12-17"), y=20089, size=10, shape=21, fill="transparent") +
    geom_hline(yintercept=5000, color="orange", size=.5) +
    theme_ipsum()


