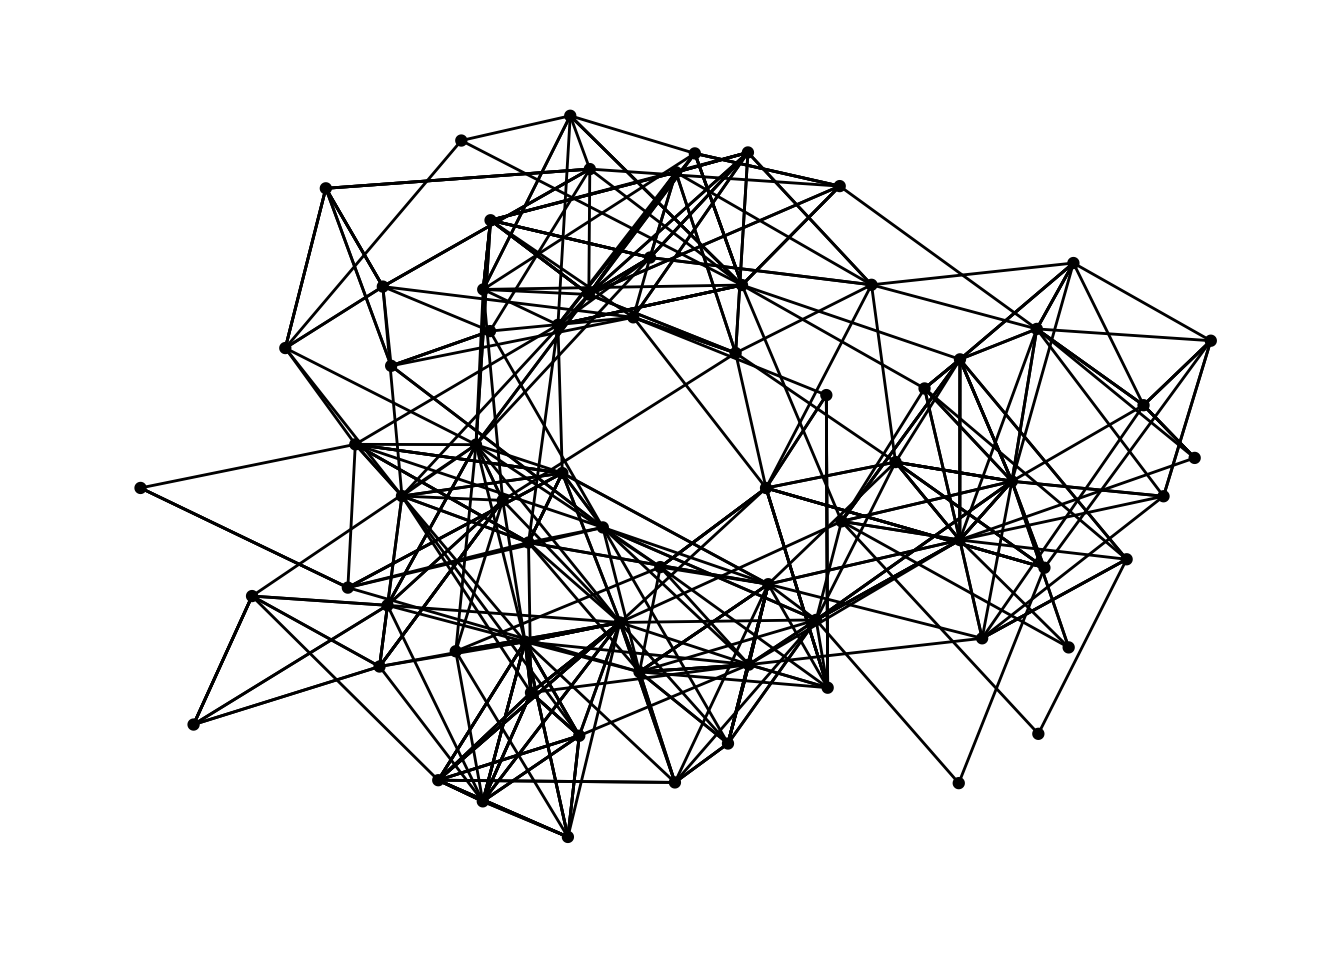
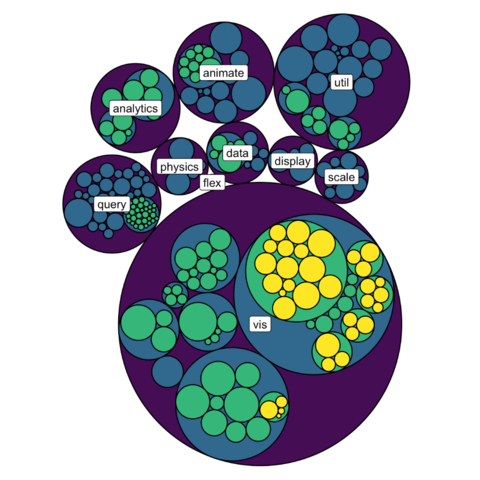
Visualizing Networks with ggraph


The ggraph package in R builds upon the ggplot2 package, enabling advanced graph and network visualizations.
This post explores the key features of ggraph through a series of graph visualization examples.

Documentation

{ggraph}

Quick start


The ggraph package in R extends the capabilities of the ggplot2 package for creating sophisticated graph visualizations.

It offers a rich set of layouts and aesthetic options that make it easy to represent complex network structures visually.

✍️ author → Thomas Lin Pedersen

📘 documentationgithub

⭐️ more than 1000 stars on github

Installation


To get started with ggraph, you can install it directly from CRAN using the install.packages function:

install.packages("ggraph")

Basic usage


Network graphs requires a special data format based on 2 core components: nodes and edges.

The ggraph package offers a as_tbl_graph() function to convert a data frame into a graph object. Once you have a graph object, you can use the ggraph() function to create any type of graph visualization.

And that’s where the magic happens! The ggraph package builds upon the ggplot2 package, enabling you to create sophisticated graph visualizations, such as:

Here’s a basic example with the highschool dataset and a simple network graph:

library(ggraph)
graph = as_tbl_graph(highschool)

ggraph(graph) +
  geom_edge_link() +
  geom_node_point() +
  theme_graph(background = 'white')

Key features


→ Map node color

You can map node color to your graph elements to encode additional data.

Example:

library(ggraph)
graph <- as_tbl_graph(highschool) |> 
    mutate(Popularity = centrality_degree(mode = 'in'))

ggraph(graph, layout = 'fr') +
  geom_edge_link() +
  geom_node_point(aes(color = Popularity, size=10)) +
  theme_graph(background = 'white')

→ Map edge color

You can also map edge color to your graph elements to highlight relationships between nodes.

Example:

library(ggraph)
graph <- as_tbl_graph(highschool)

ggraph(graph) +
  geom_edge_link(aes(color = factor(year))) +
  geom_node_point() +
  theme_graph(background = 'white')

→ Circular layout

The ggraph package supports a circular layout that can be used to represent network data in a circular form.

Example:

library(ggraph)

ggraph(graph, layout = 'linear', circular = TRUE) + 
  geom_edge_arc(aes(colour = factor(year))) + 
  coord_fixed() +
  theme_graph(background = 'white')

→ Treemap layout

The ggraph package also supports a treemap layout that can be used to represent hierarchical data in a tree structure.

Example:

library(ggraph)
graph <- tbl_graph(flare$vertices, flare$edges)

ggraph(graph, 'treemap', weight = size) + 
  geom_node_tile(aes(fill = depth), size = 0.2) +
  theme_graph(background = 'white')


Contact

This document is a work by Yan Holtz. Any feedback is highly encouraged. You can fill an issue on Github, drop me a message on Twitter, or send an email pasting yan.holtz.data with gmail.com.

Github Twitter