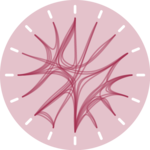
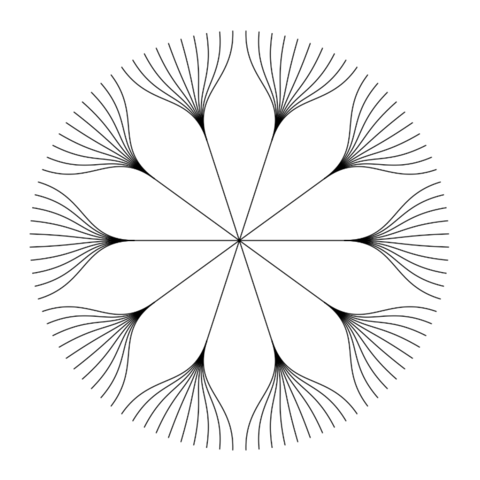
What is hierarchical edge bundling?
The following post will guide you through the basics of hierarchical edge bundling. It explains what this kind of chart really is, describing step by step how to build it in R with the graph package.


Input data
You need at least 2 inputs for hierarchical edge bundling:
- A hierarchical network structure, also called tree
- An adjacency matrix that describes connections between some nodes of the tree
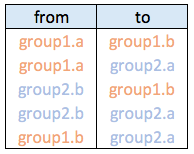
Connections data frame:
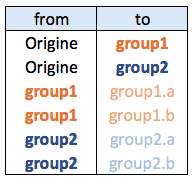
Hierarchical network data frame:
Node and Connection color
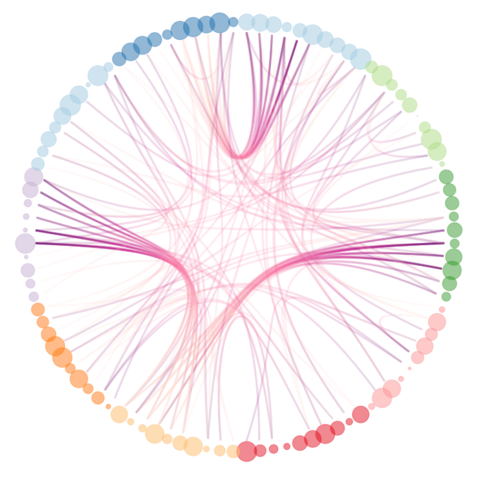
You can customize node and connection features to add more insight to the chart. For instance, you can change node color to highlight their belonging to a group, or connection color to represent its intensity


Add node labels
Last but not least, it is crucial to add labels to chart nodes. This is a bit tricky since label alignment and orientation must be computed by hand. This last example will teach you how to proceed, resulting in the figure below.
Code