Basic hierarchical edge bundling
This page follows the previous introduction to hierarchical edge bundling.
It considers you understood what inputs you need and how to build a basic version. It aims to describe how we can improve it, customizing tension, connection and node features.
First, let’s remember the R code allowing to get this very basic hierarchical edge bundling:
# Libraries
library(ggraph)
library(igraph)
library(tidyverse)

# create a data frame giving the hierarchical structure of your individuals
set.seed(1234)
d1 <- data.frame(from="origin", to=paste("group", seq(1,10), sep=""))
d2 <- data.frame(from=rep(d1$to, each=10), to=paste("subgroup", seq(1,100), sep="_"))
hierarchy <- rbind(d1, d2)

# create a dataframe with connection between leaves (individuals)
all_leaves <- paste("subgroup", seq(1,100), sep="_")
connect <- rbind(
  data.frame( from=sample(all_leaves, 100, replace=T) , to=sample(all_leaves, 100, replace=T)),
  data.frame( from=sample(head(all_leaves), 30, replace=T) , to=sample( tail(all_leaves), 30, replace=T)),
  data.frame( from=sample(all_leaves[25:30], 30, replace=T) , to=sample( all_leaves[55:60], 30, replace=T)),
  data.frame( from=sample(all_leaves[75:80], 30, replace=T) , to=sample( all_leaves[55:60], 30, replace=T)) )
connect$value <- runif(nrow(connect))

# create a vertices data.frame. One line per object of our hierarchy
vertices  <-  data.frame(
  name = unique(c(as.character(hierarchy$from), as.character(hierarchy$to))) ,
  value = runif(111)
)
# Let's add a column with the group of each name. It will be useful later to color points
vertices$group  <-  hierarchy$from[ match( vertices$name, hierarchy$to ) ]


# Create a graph object
mygraph <- graph_from_data_frame( hierarchy, vertices=vertices )

# The connection object must refer to the ids of the leaves:
from  <-  match( connect$from, vertices$name)
to  <-  match( connect$to, vertices$name)

# Basic graph
ggraph(mygraph, layout = 'dendrogram', circular = TRUE) +
  geom_conn_bundle(data = get_con(from = from, to = to), alpha=0.2, colour="skyblue", tension = .5) +
  geom_node_point(aes(filter = leaf, x = x*1.05, y=y*1.05)) +
  theme_void()
Playing with tension
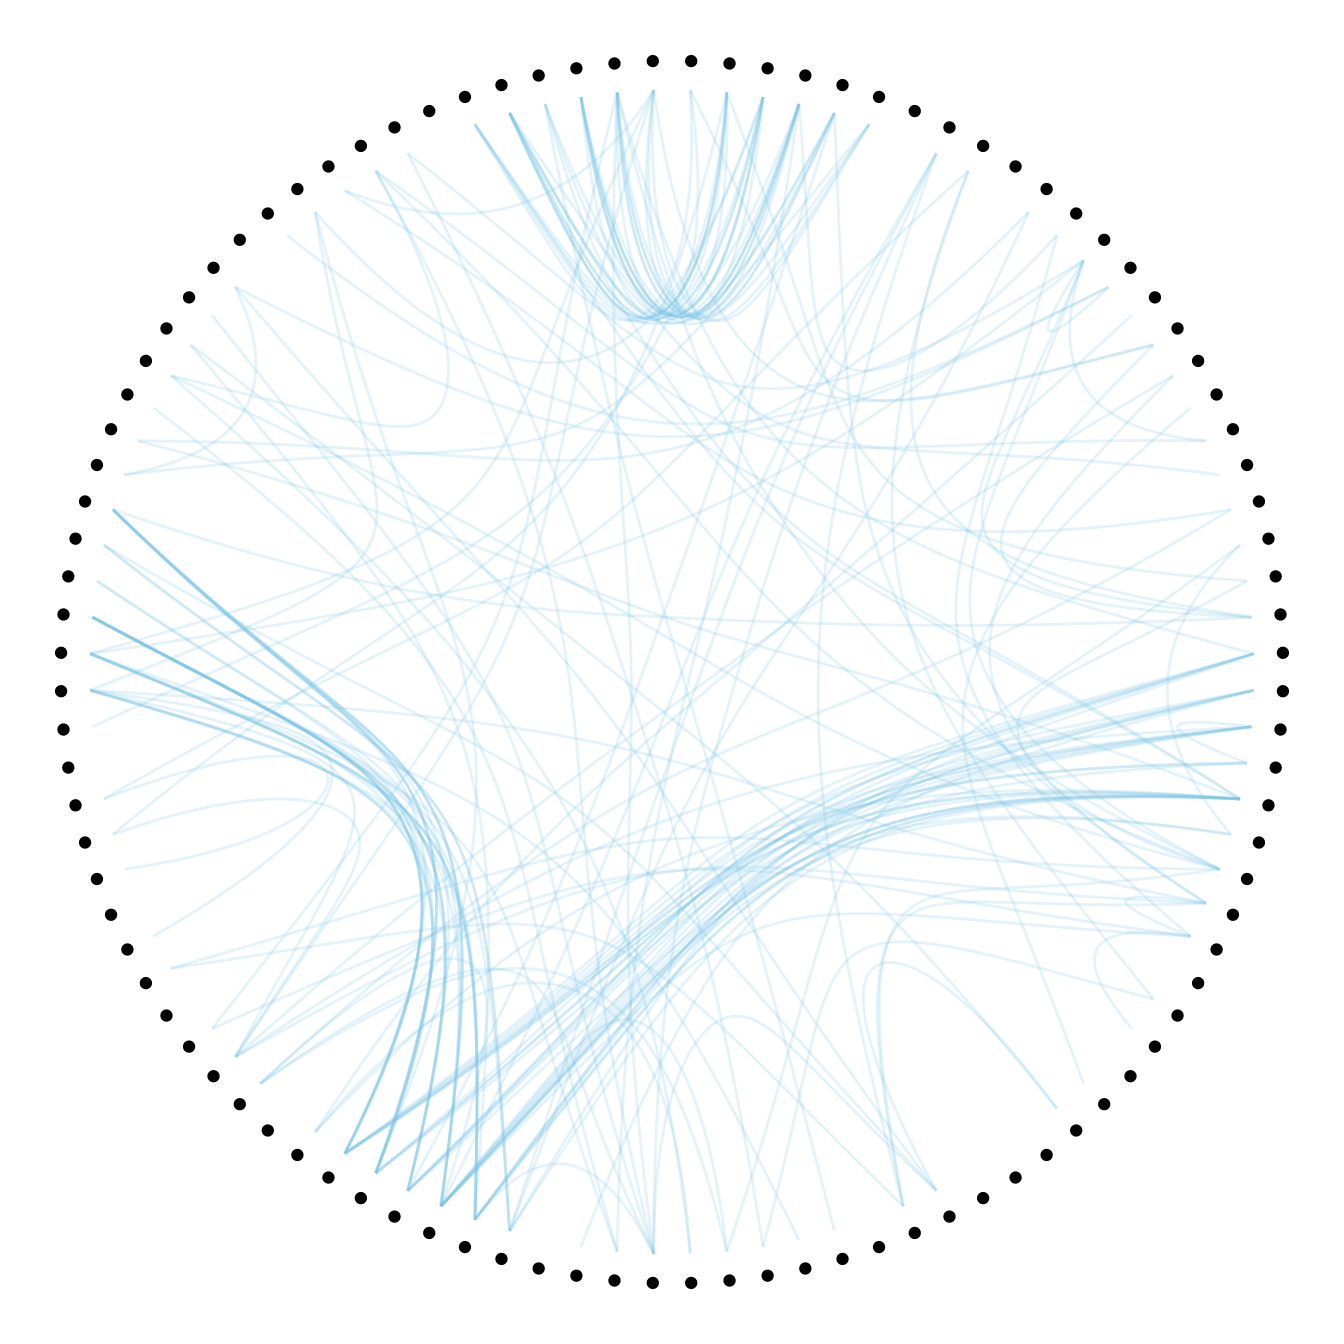
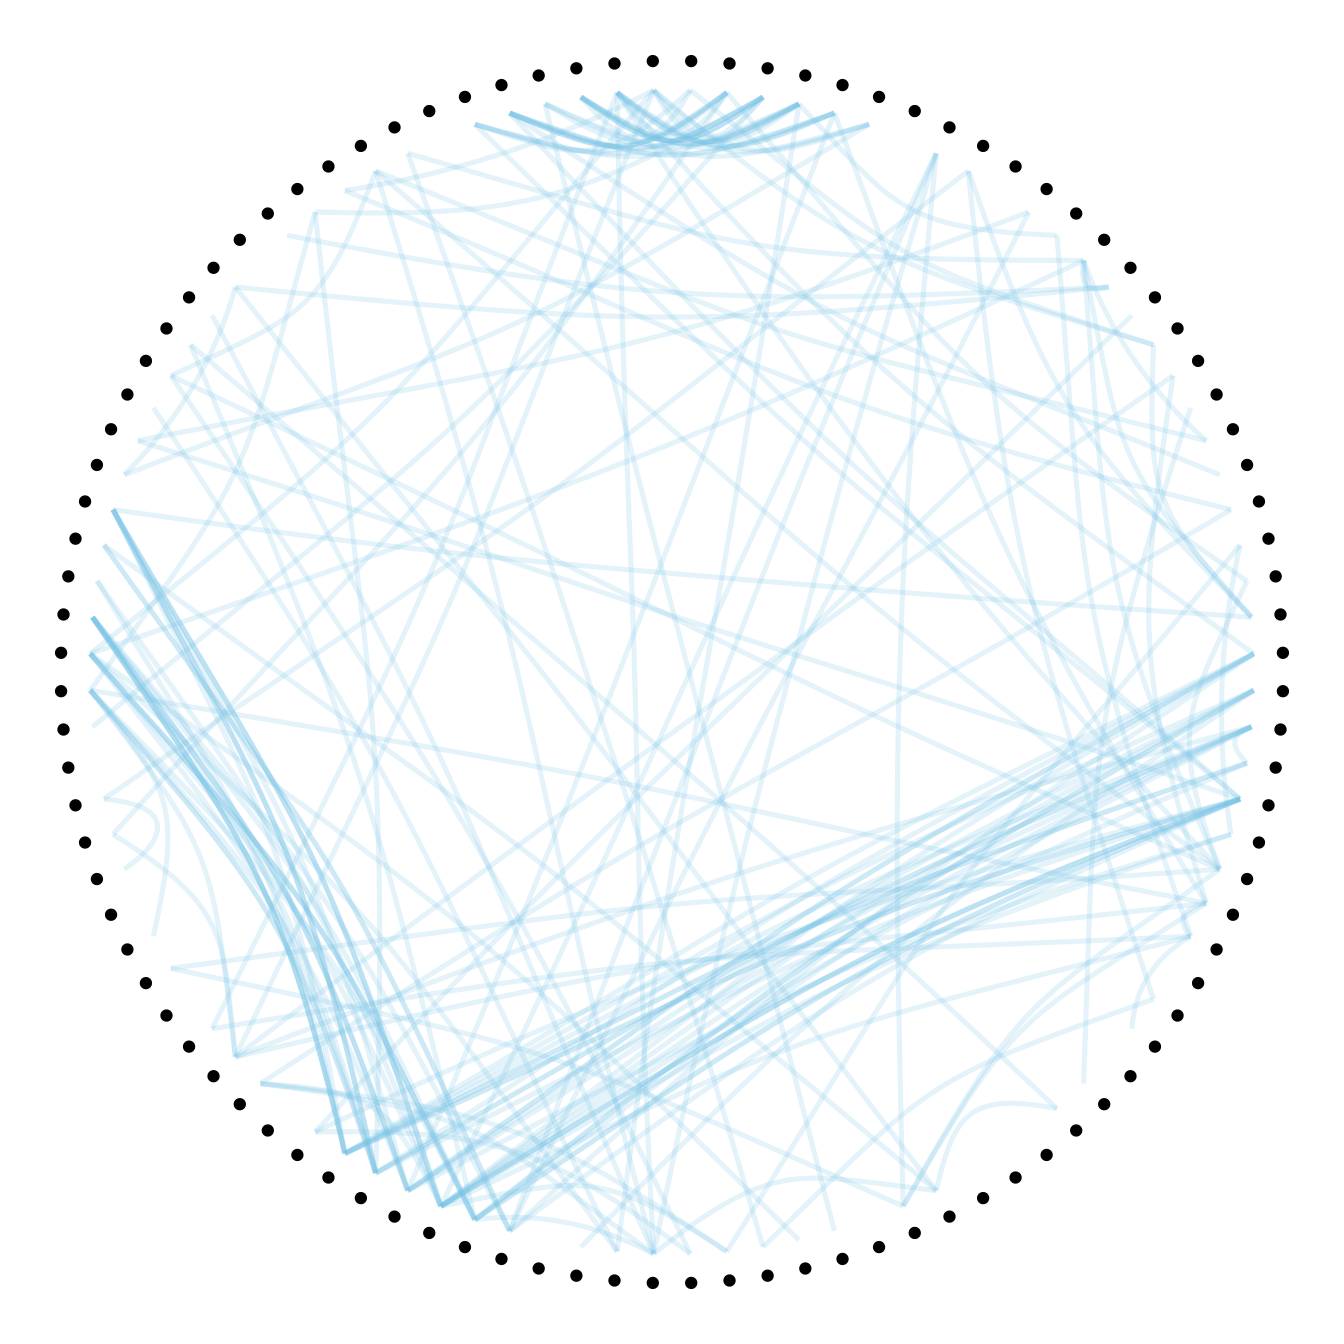
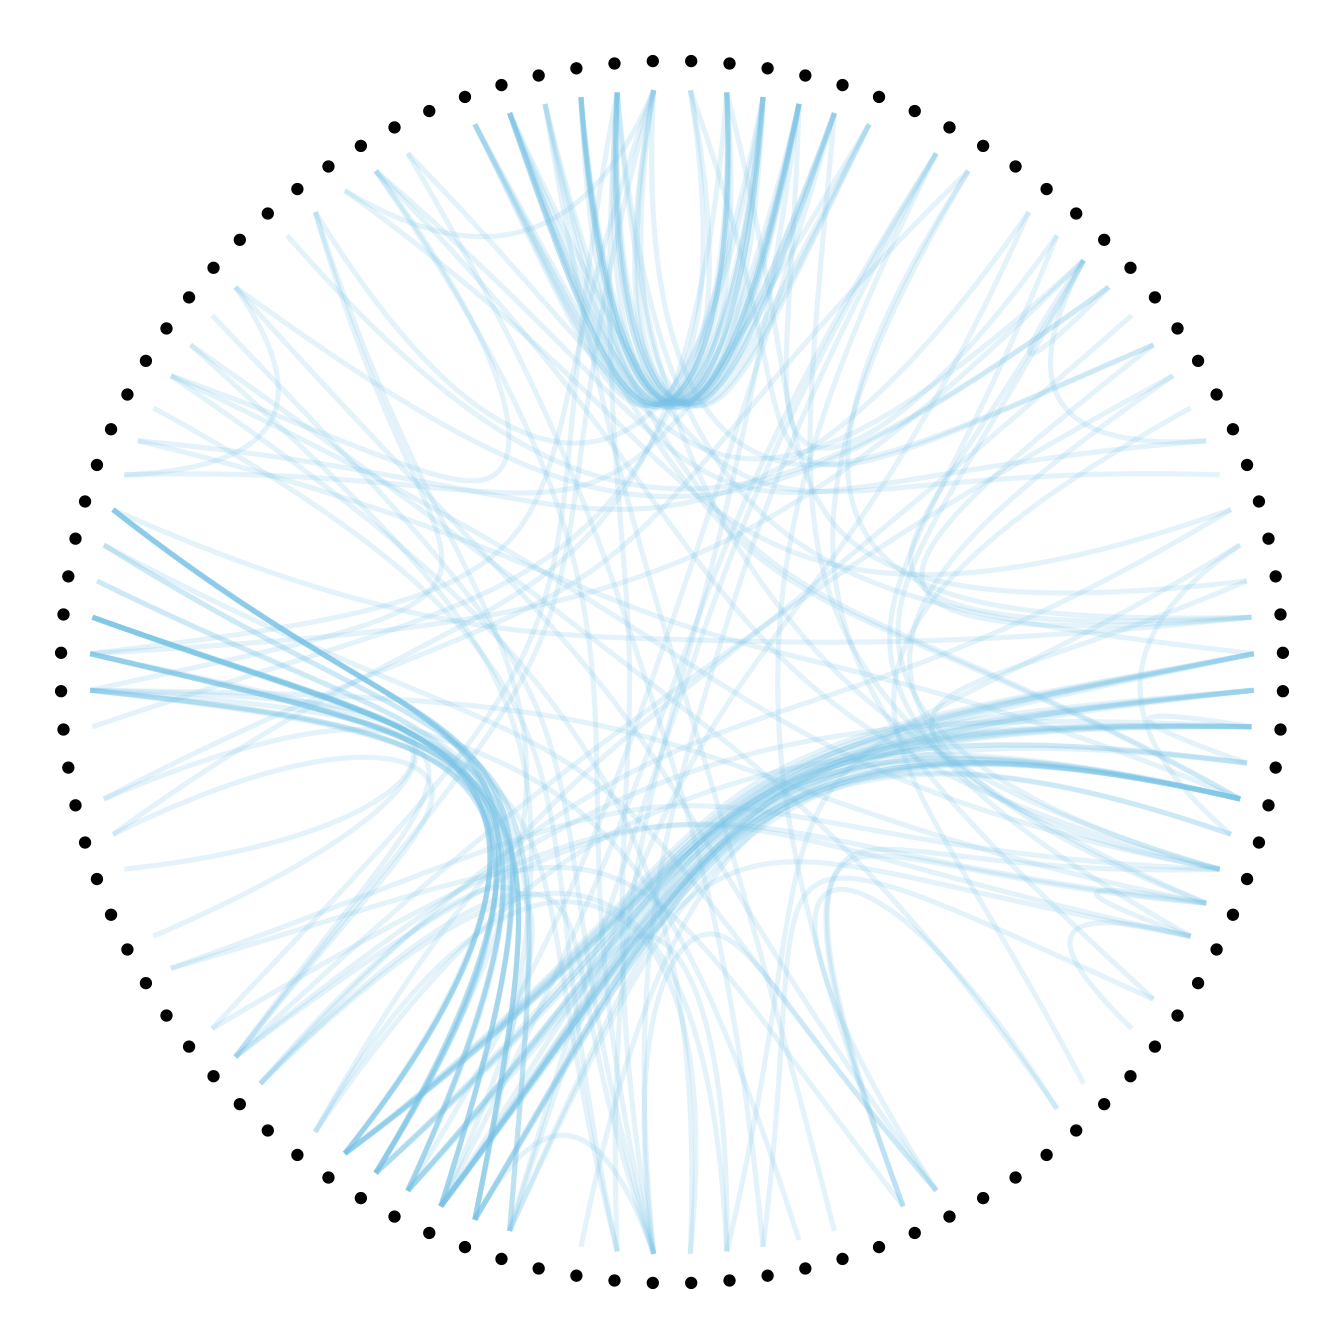
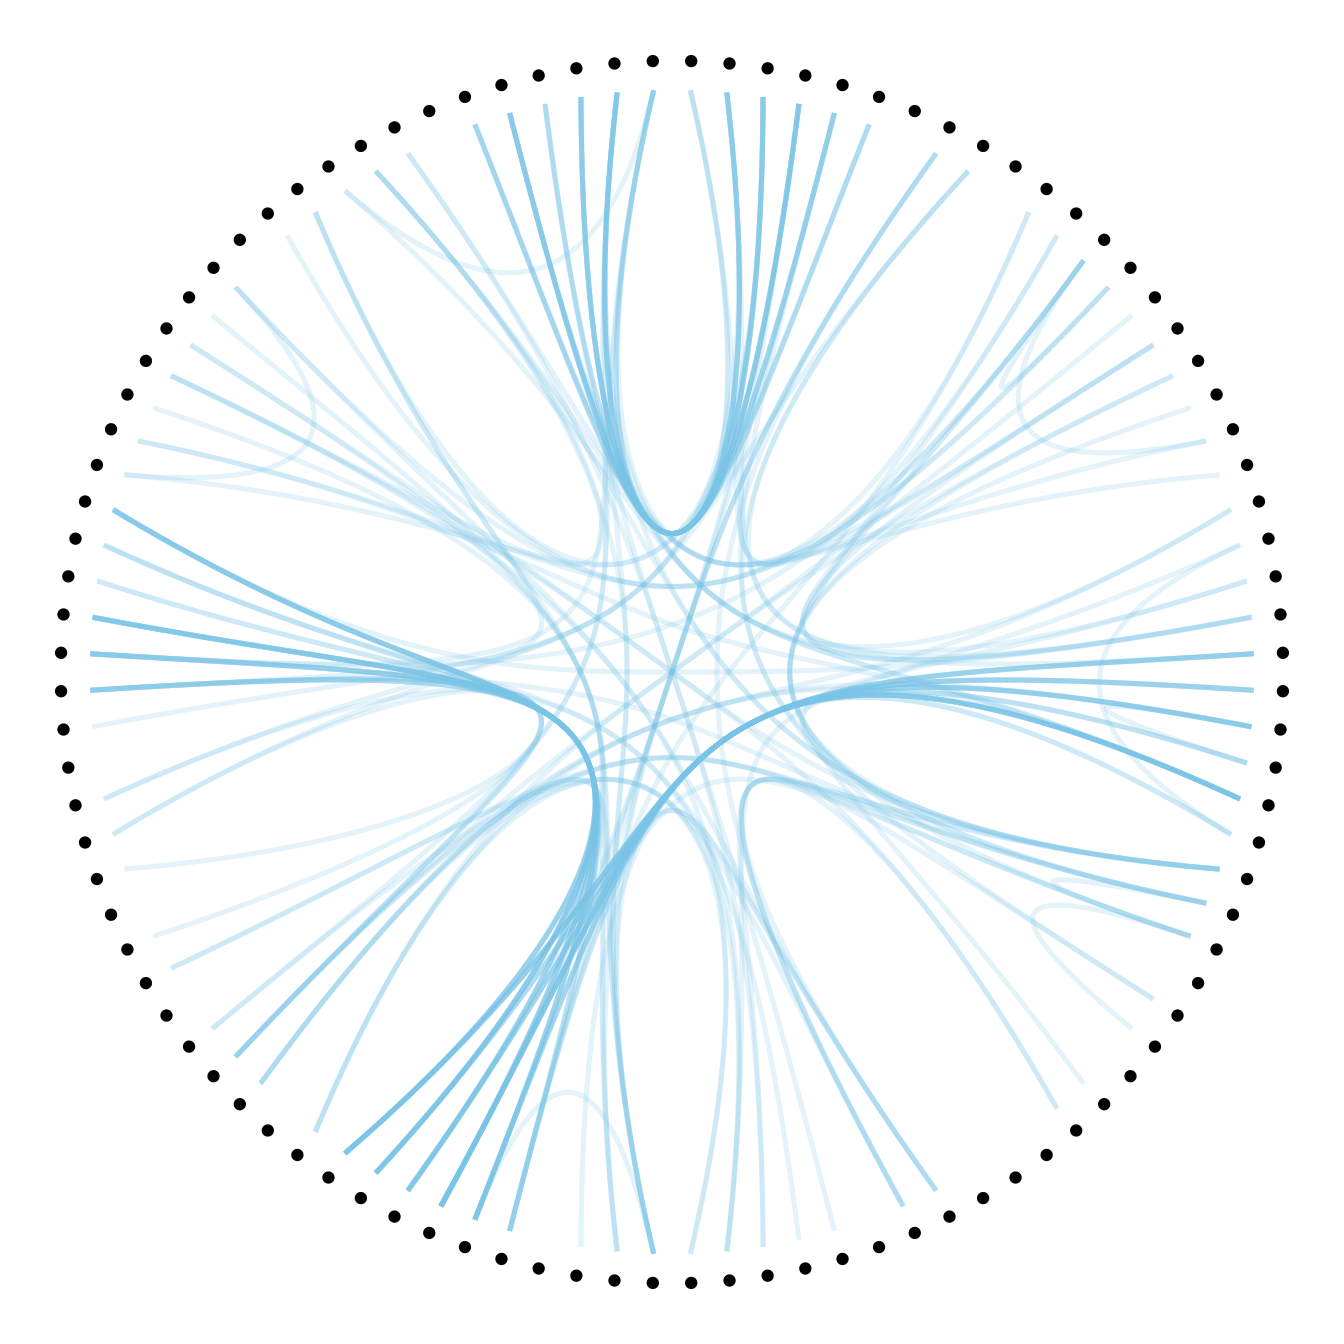
The first thing we can play with is the tension of the
connections. A tension of 0 means straight lines. A connection of 1
means maximal curvature: the connections follow the hierarchical
structure of the network as much as they can.
Let’s have a look to the effect of different values.
p <- ggraph(mygraph, layout = 'dendrogram', circular = TRUE) +
  geom_node_point(aes(filter = leaf, x = x*1.05, y=y*1.05)) +
  theme_void()

# 0.1
p +  geom_conn_bundle(data = get_con(from = from, to = to), alpha=0.2, colour="skyblue", width=0.9,
                      tension=0.1)
# 0.7
p +  geom_conn_bundle(data = get_con(from = from, to = to), alpha=0.2, colour="skyblue", width=0.9,
                      tension=0.7)
#1
p +  geom_conn_bundle(data = get_con(from = from, to = to), alpha=0.2, colour="skyblue", width=0.9,
                      tension=1)
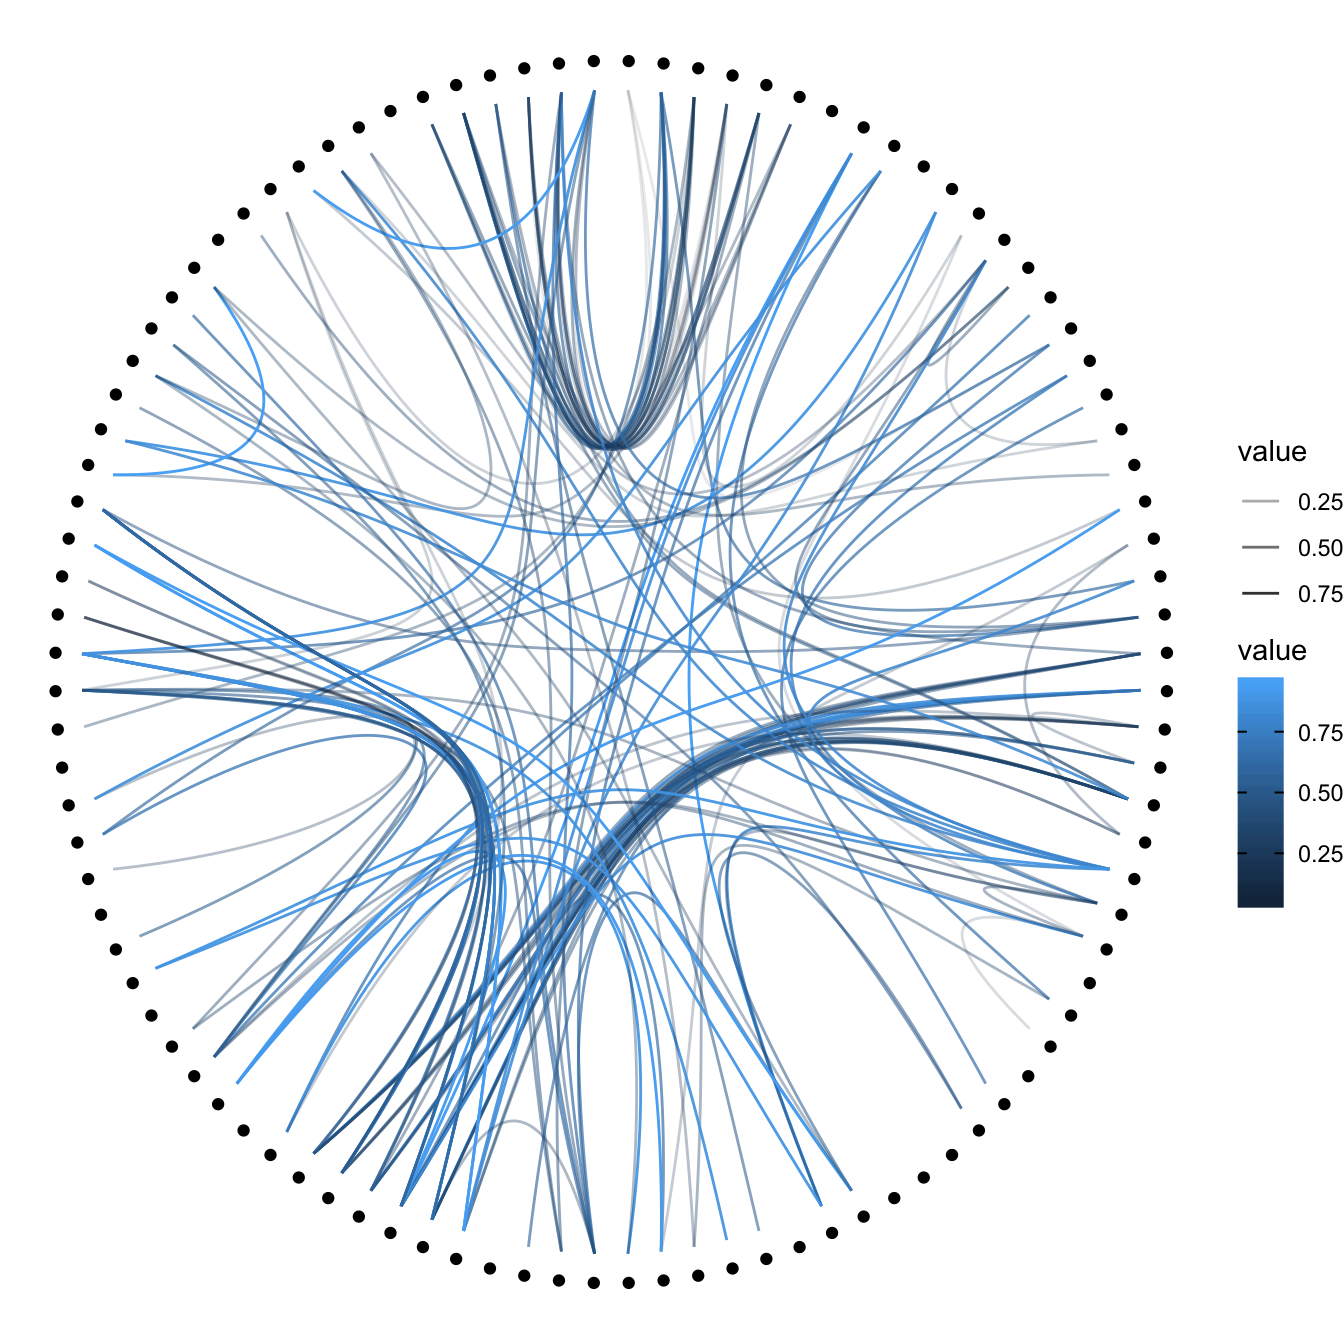
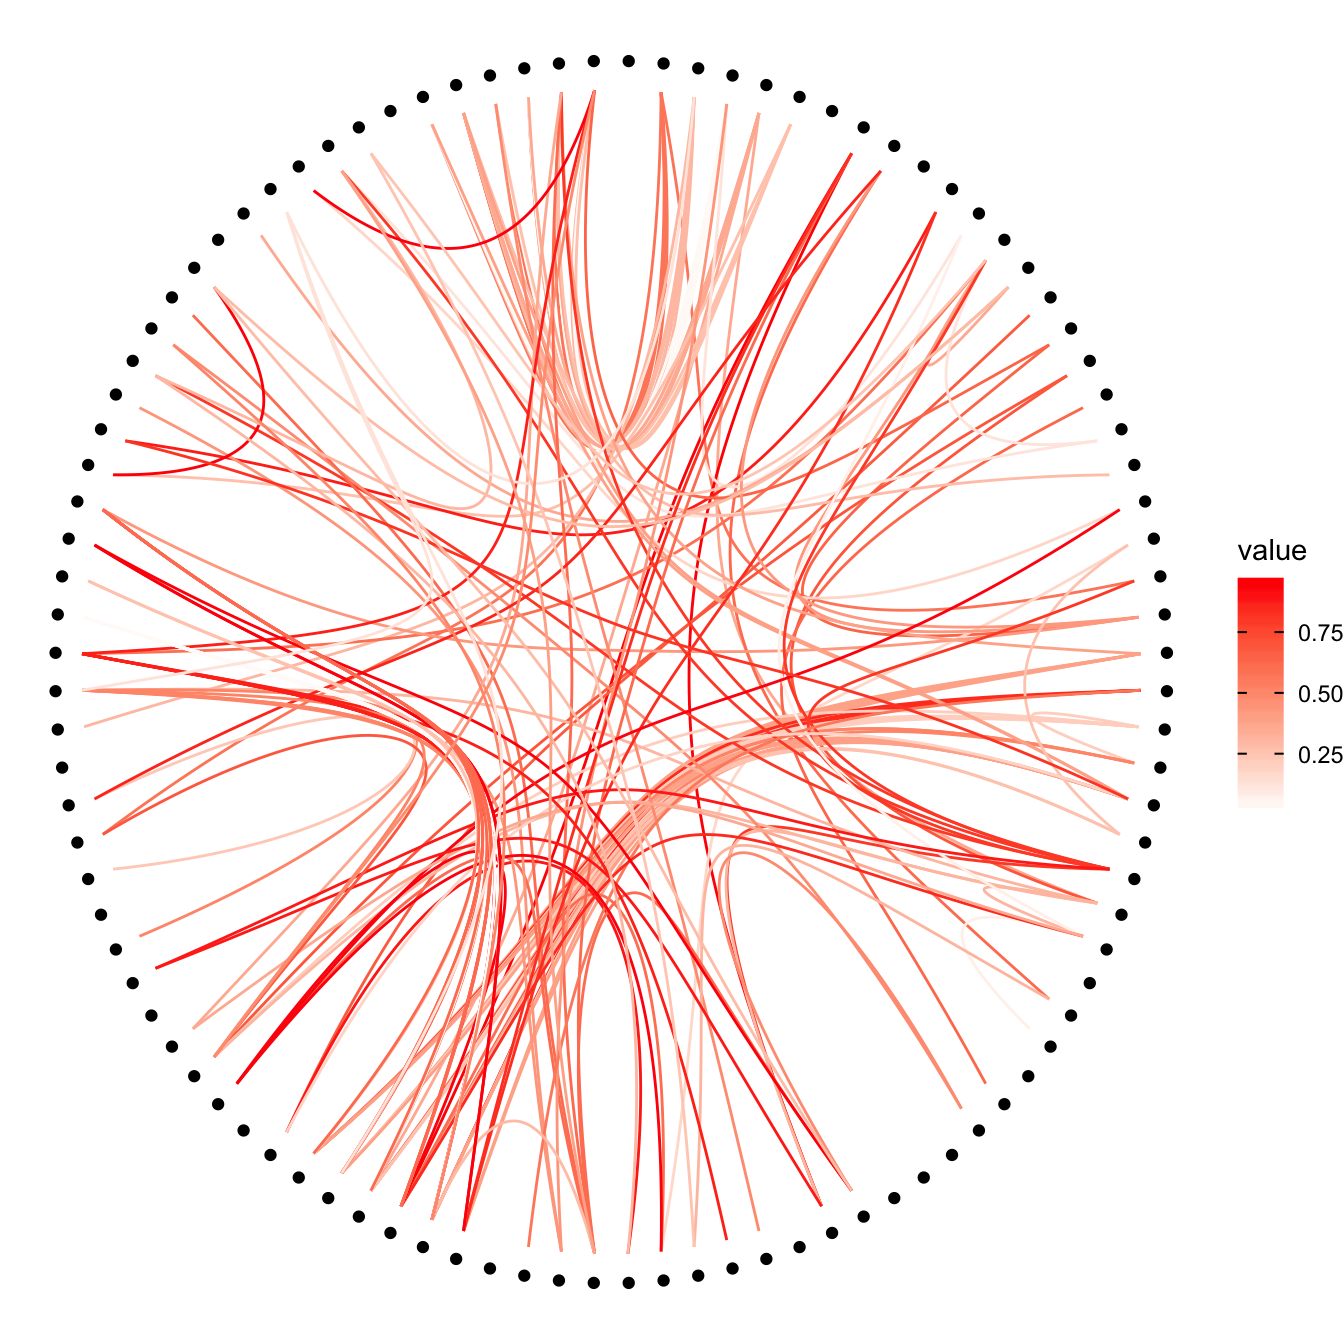
Connection features
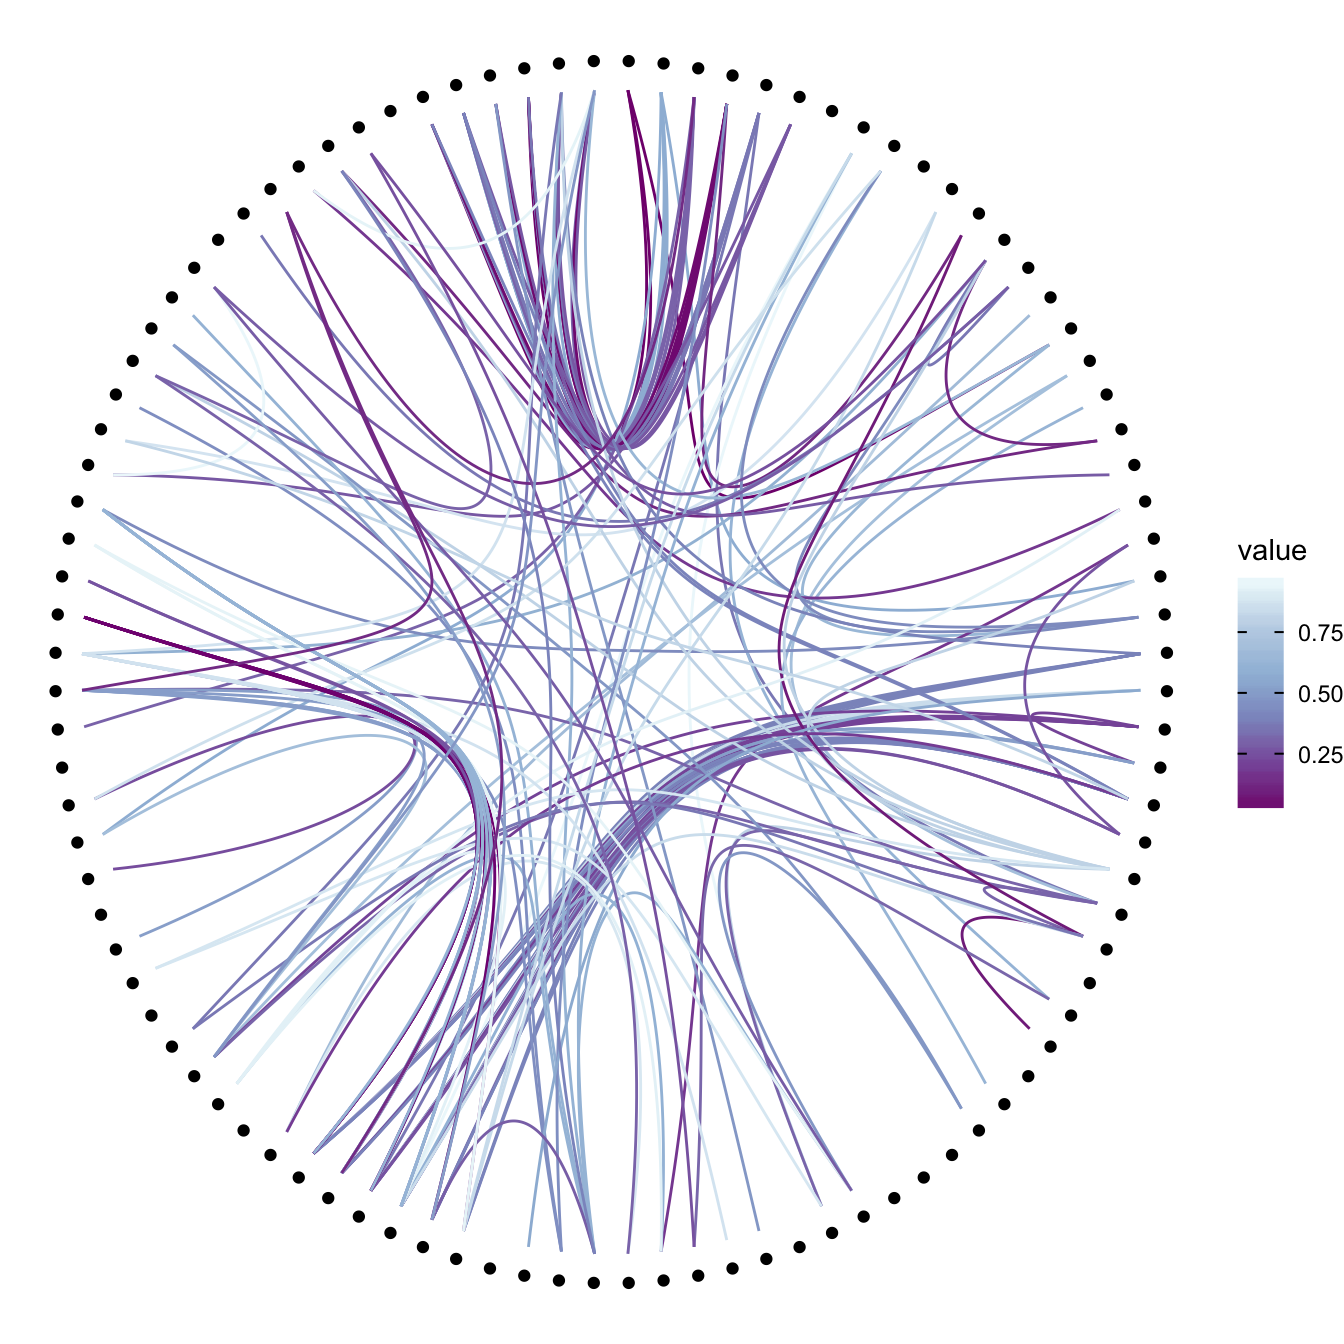
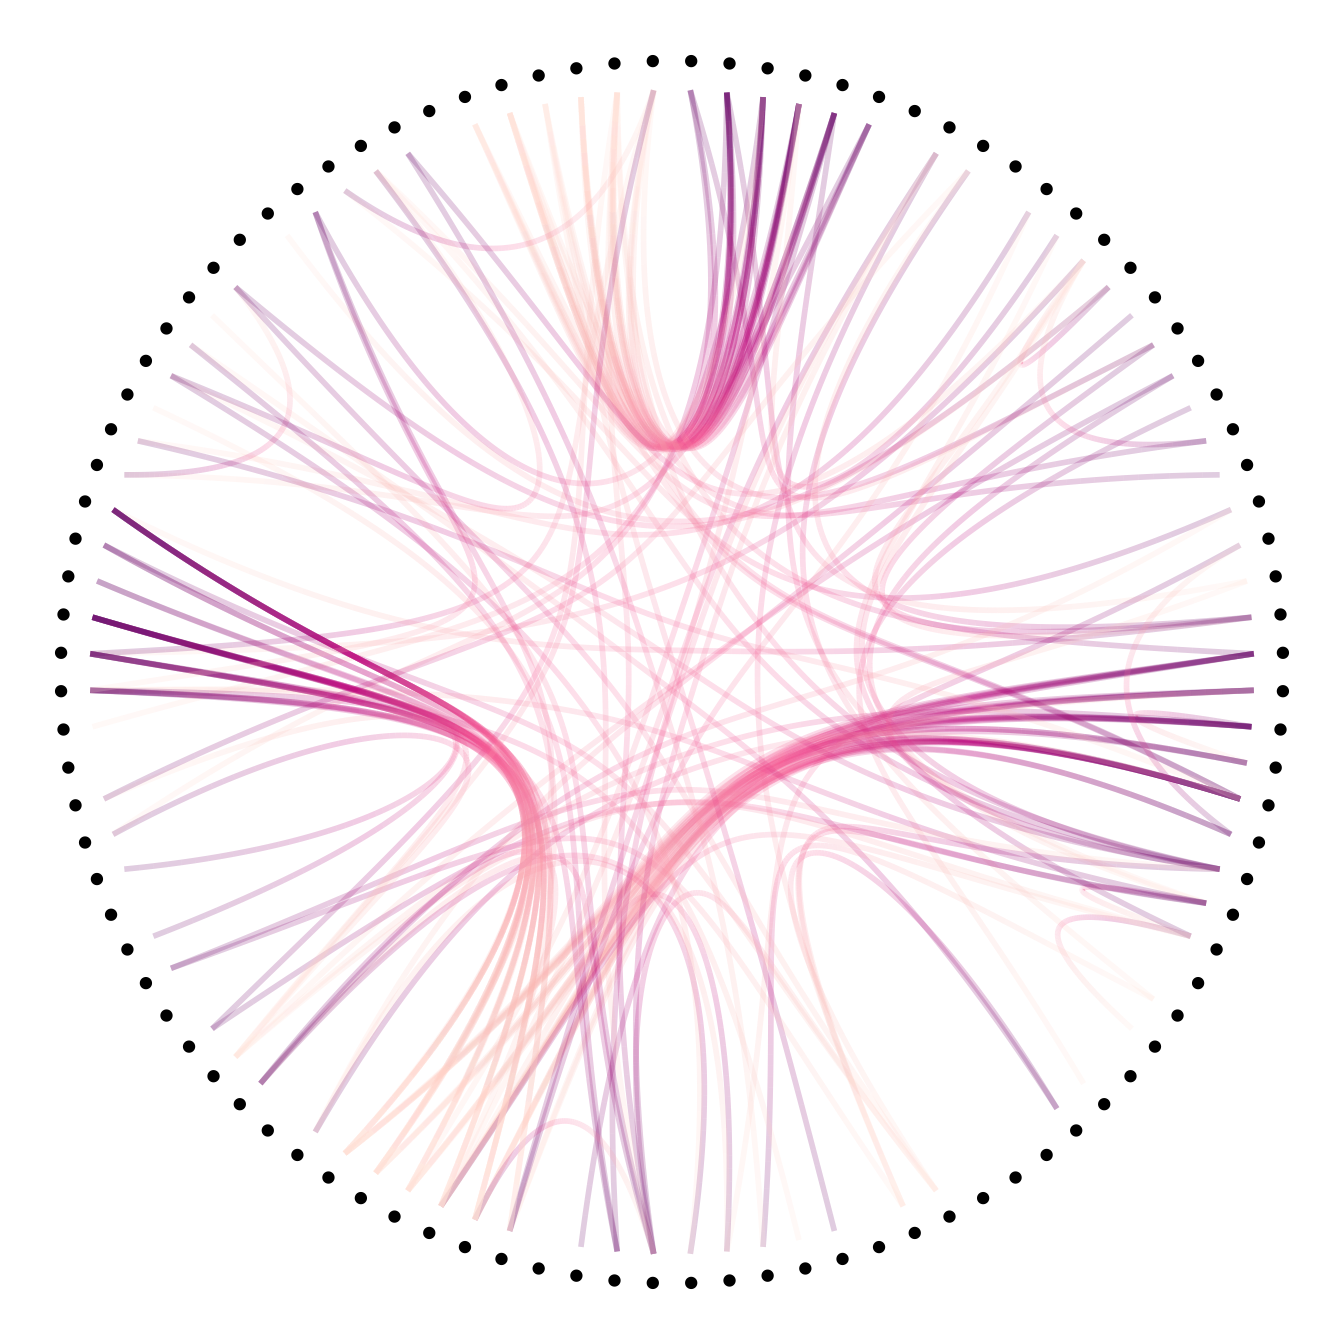
Then we can play with the colour and transparency of connections. We have seen how to pick up a unique color in the example above. We can also map a specific variable to it like we are used to do with ggplot2 (chart 1 and 2 below)! Another possibility is to make the color evolves along the trajectory: the ‘from’ and the ‘to’ have different color. This is useful if your connection is directed, and gives the nice effect figure 4.
# Use the 'value' column of the connection data frame for the color:
p + geom_conn_bundle(data = get_con(from = from, to = to), aes(colour=value, alpha=value))
# In this case you can change the color palette
p +
geom_conn_bundle(data = get_con(from = from, to = to), aes(colour=value)) +
scale_edge_color_continuous(low="white", high="red")
p +
geom_conn_bundle(data = get_con(from = from, to = to), aes(colour=value)) +
scale_edge_colour_distiller(palette = "BuPu")
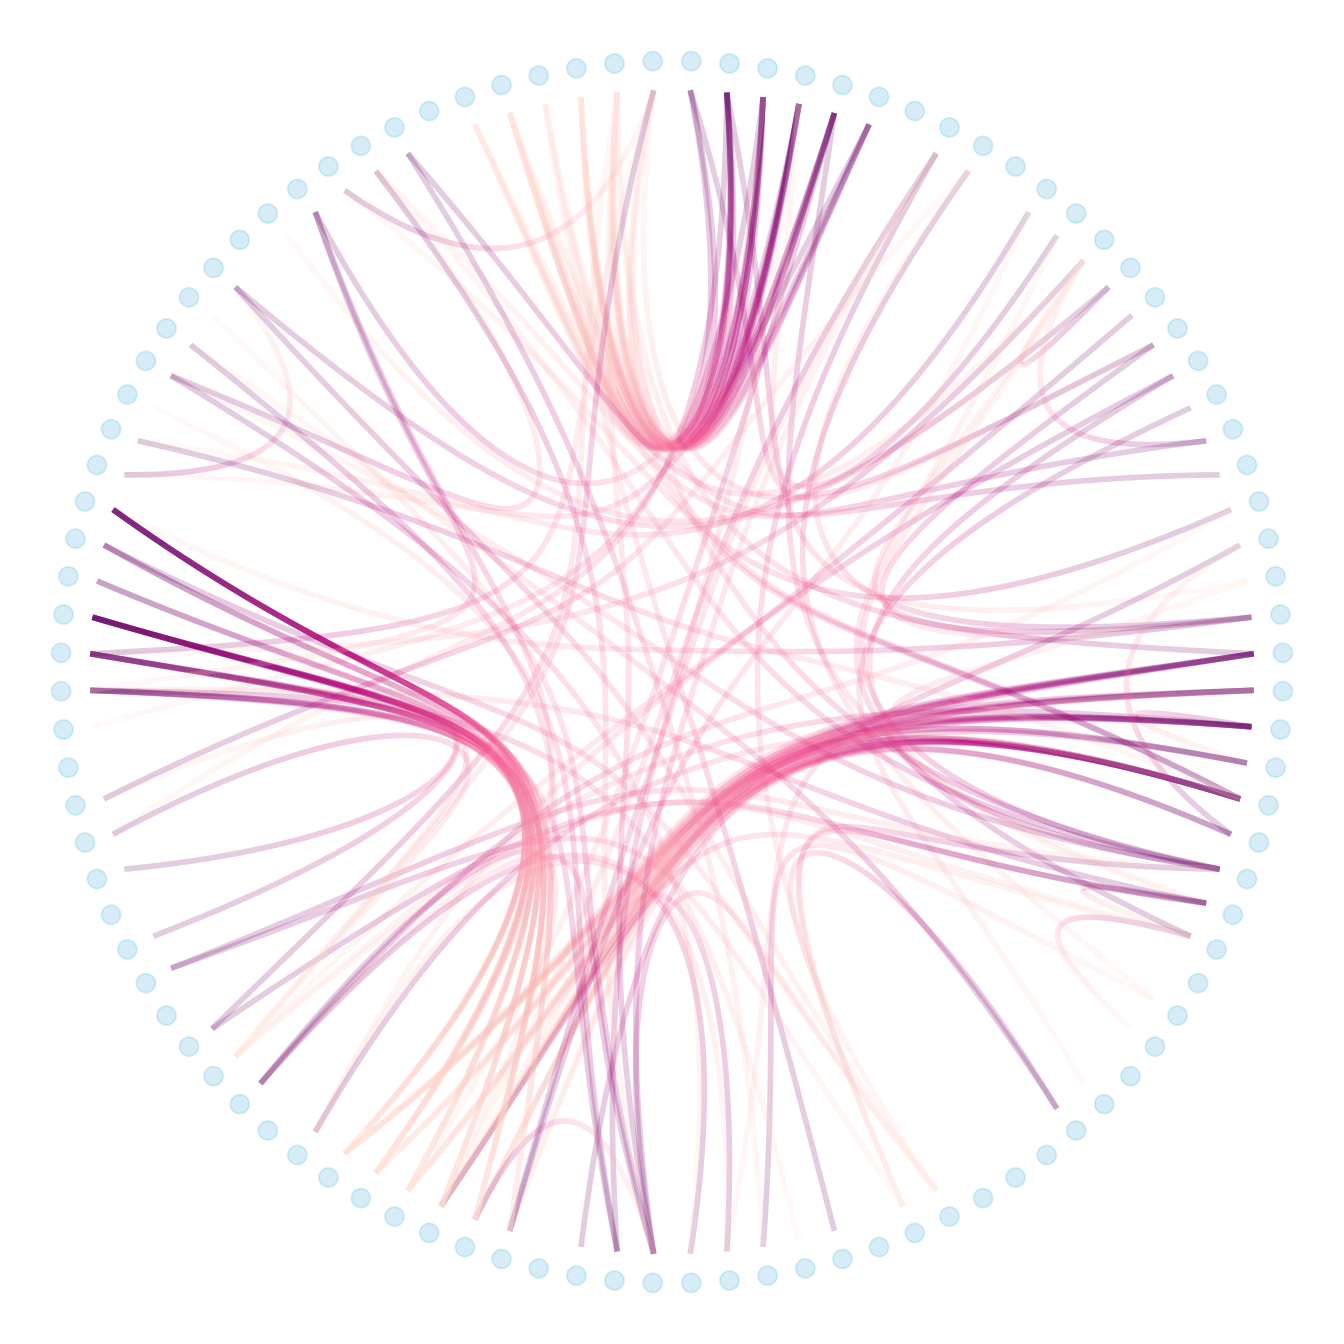
# Color depends of the index: the from and the to are different
p +
geom_conn_bundle(data = get_con(from = from, to = to), width=1, alpha=0.2, aes(colour=..index..)) +
scale_edge_colour_distiller(palette = "RdPu") +
theme(legend.position = "none")
Node features
Finally we can custom the points as well, like for a classic ggplot2 graphic. It is a good practice to make the color depends of the classification of the point, it allows to make the hierarchy more obvious. In the last example, I map a column to the size of the points!
# Basic usual argument
p=ggraph(mygraph, layout = 'dendrogram', circular = TRUE) +
geom_conn_bundle(data = get_con(from = from, to = to), width=1, alpha=0.2, aes(colour=..index..)) +
scale_edge_colour_distiller(palette = "RdPu") +
theme_void() +
theme(legend.position = "none")
# just a blue uniform color. Note that the x*1.05 allows to make a space between the points and the connection ends
p + geom_node_point(aes(filter = leaf, x = x*1.05, y=y*1.05), colour="skyblue", alpha=0.3, size=3)
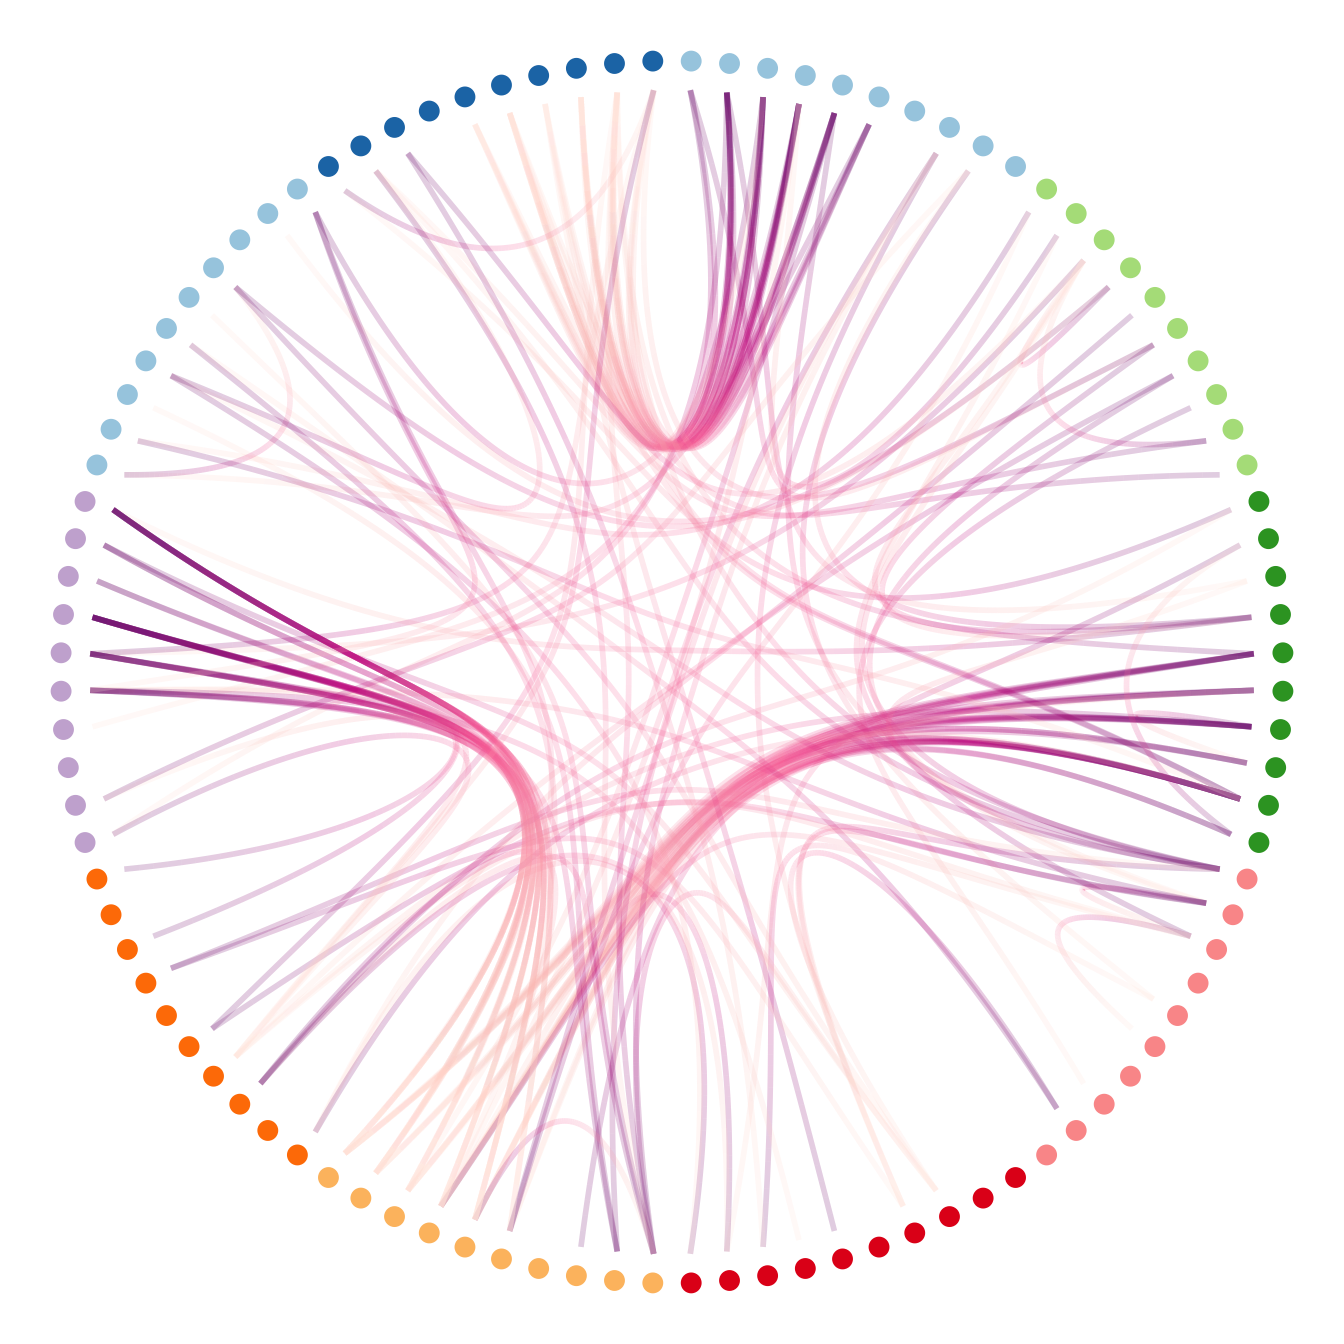
# It is good to color the points following their group appartenance
library(RColorBrewer)
p + geom_node_point(aes(filter = leaf, x = x*1.05, y=y*1.05, colour=group), size=3) +
scale_colour_manual(values= rep( brewer.pal(9,"Paired") , 30))
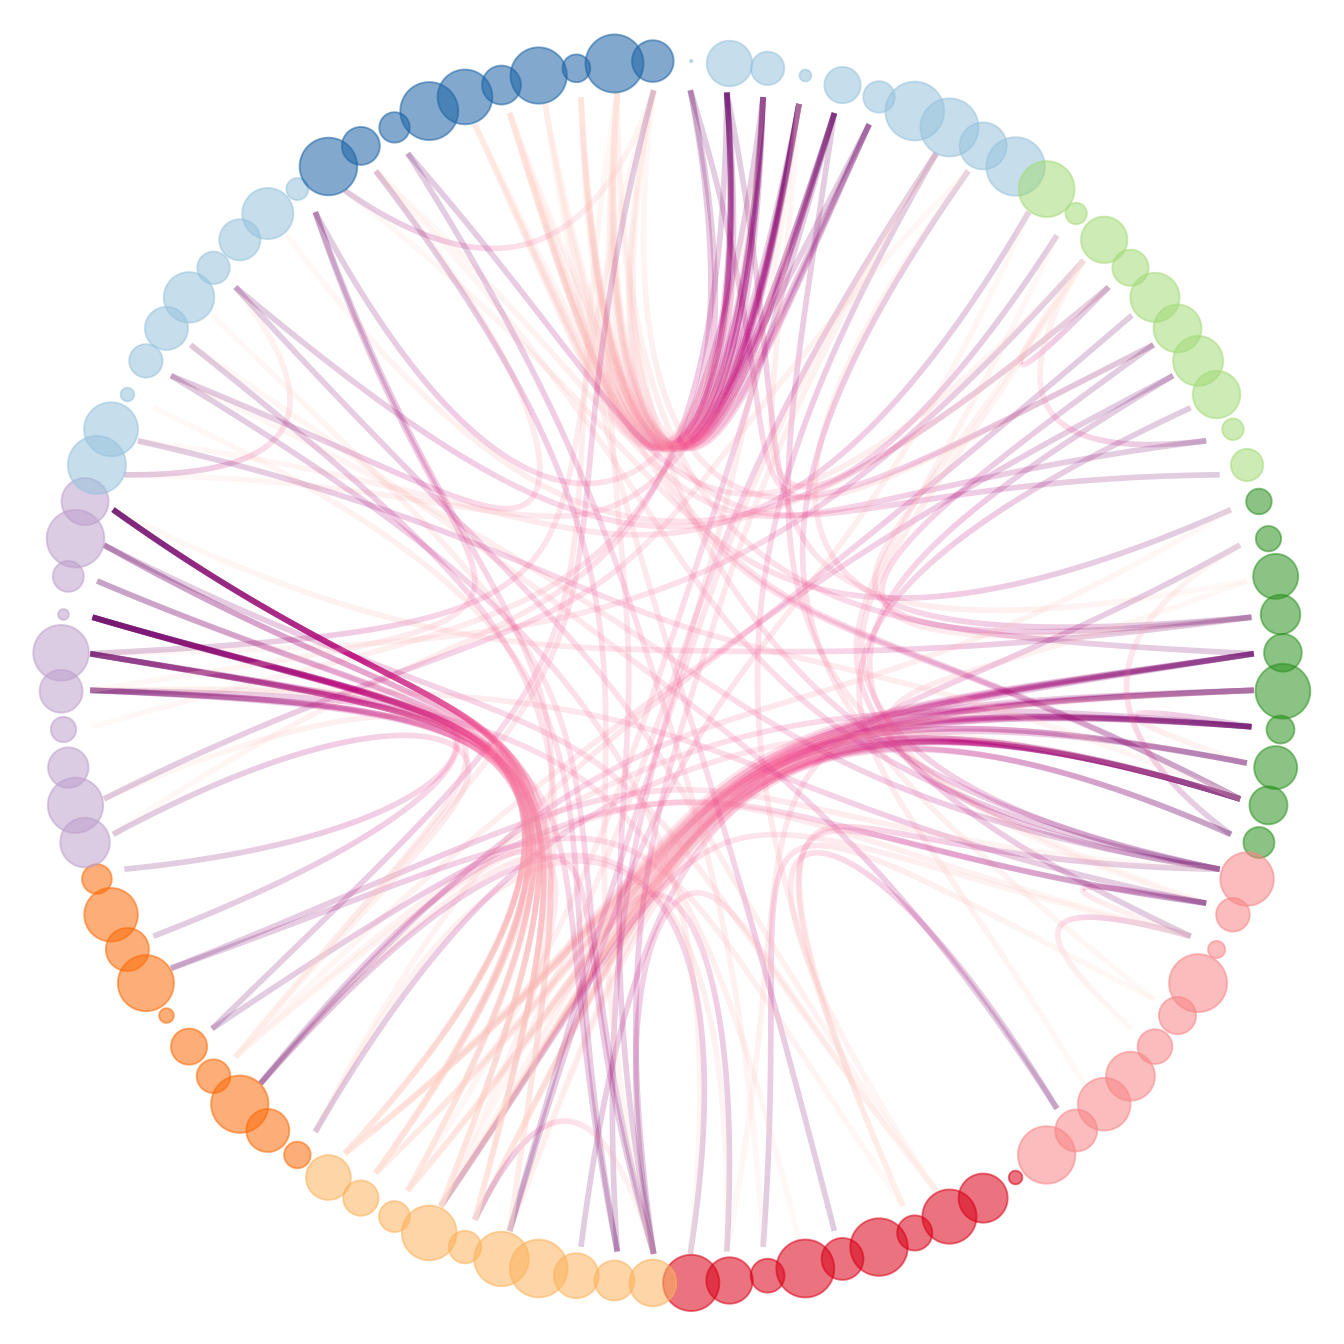
# And you can adjust the size to whatever variable quite easily!
p +
geom_node_point(aes(filter = leaf, x = x*1.05, y=y*1.05, colour=group, size=value, alpha=0.2)) +
scale_colour_manual(values= rep( brewer.pal(9,"Paired") , 30)) +
scale_size_continuous( range = c(0.1,10) )