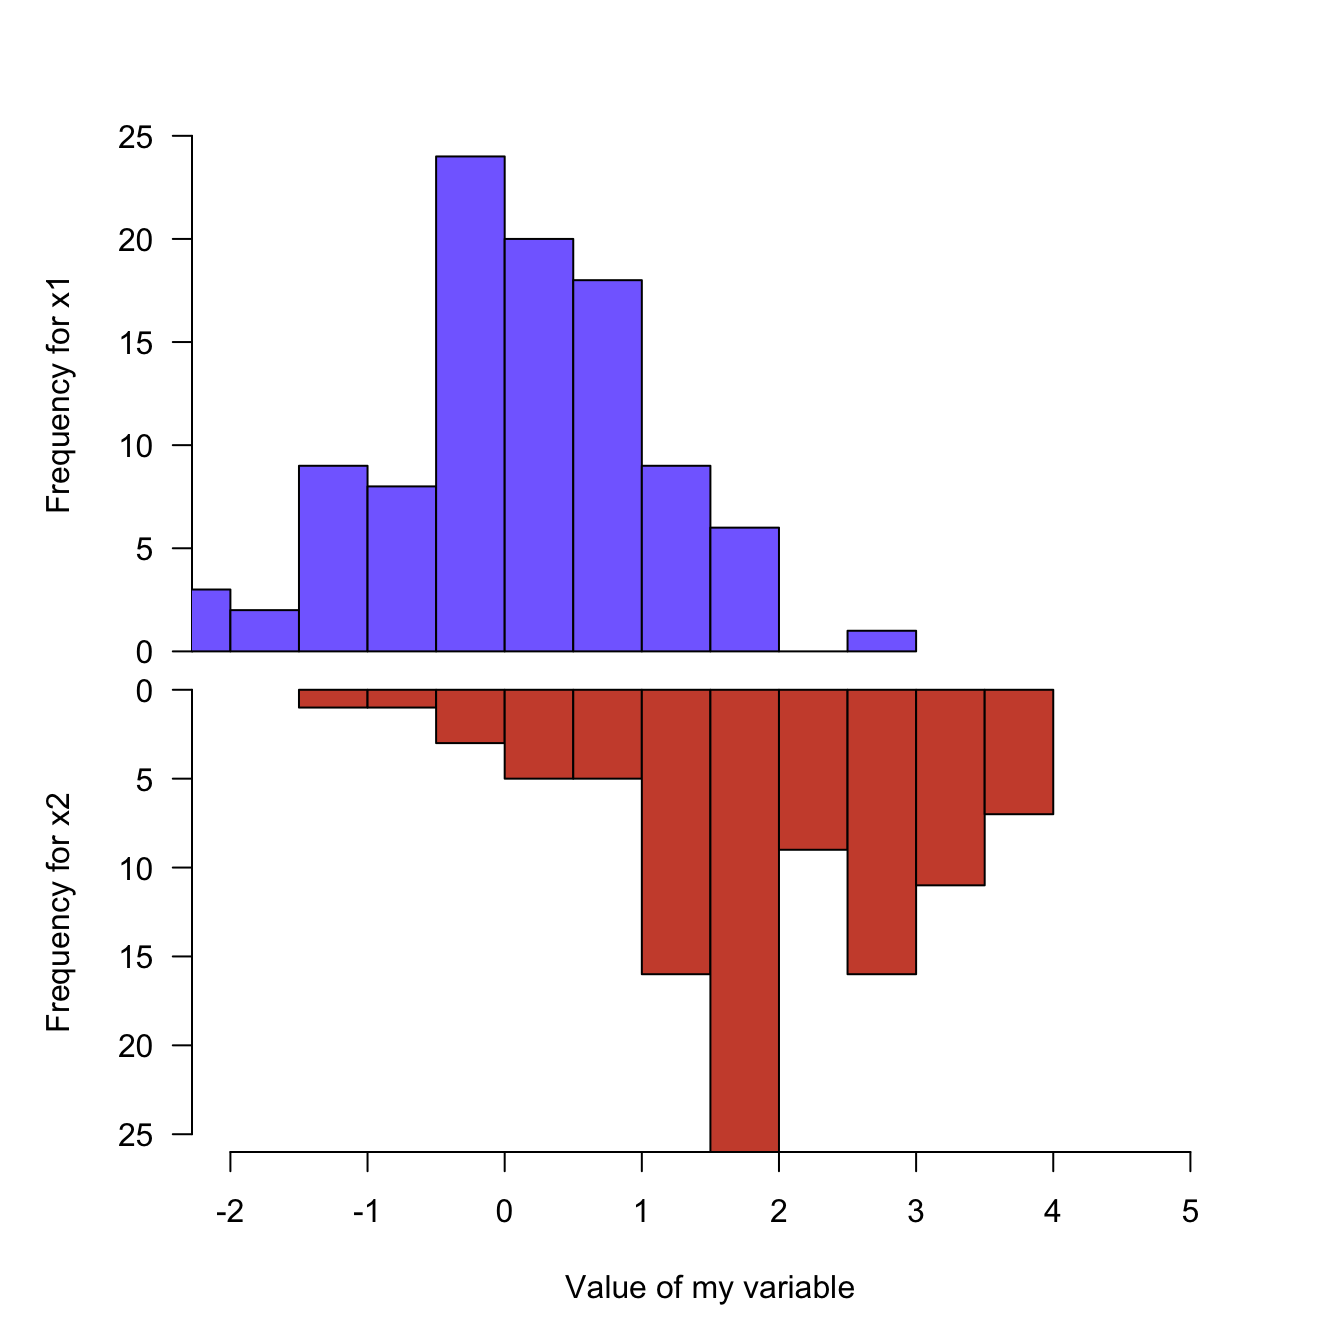
The mirrored histogram allows to compare the distribution of 2 variables.
First split the screen with the par(mfrow()) command.
The top histogram needs a xaxt="n" statement
to discard its X axis. For the second one, inverse the values of the
ylim argument to flip it upside down. Use the
margin command to adjust the position of the 2 charts.
#Create Data
x1 = rnorm(100)
x2 = rnorm(100)+rep(2,100)
par(mfrow=c(2,1))

#Make the plot
par(mar=c(0,5,3,3))
hist(x1 , main="" , xlim=c(-2,5), ylab="Frequency for x1", xlab="", ylim=c(0,25) , xaxt="n", las=1 , col="slateblue1", breaks=10)
par(mar=c(5,5,0,3))
hist(x2 , main="" , xlim=c(-2,5), ylab="Frequency for x2", xlab="Value of my variable", ylim=c(25,0) , las=1 , col="tomato3"  , breaks=10)