Boxplot categories are provided in a
column of the input data frame. This column needs to be a
factor, and has several levels. Categories
are displayed on the chart following the order of this factor, often
in alphabetical order.
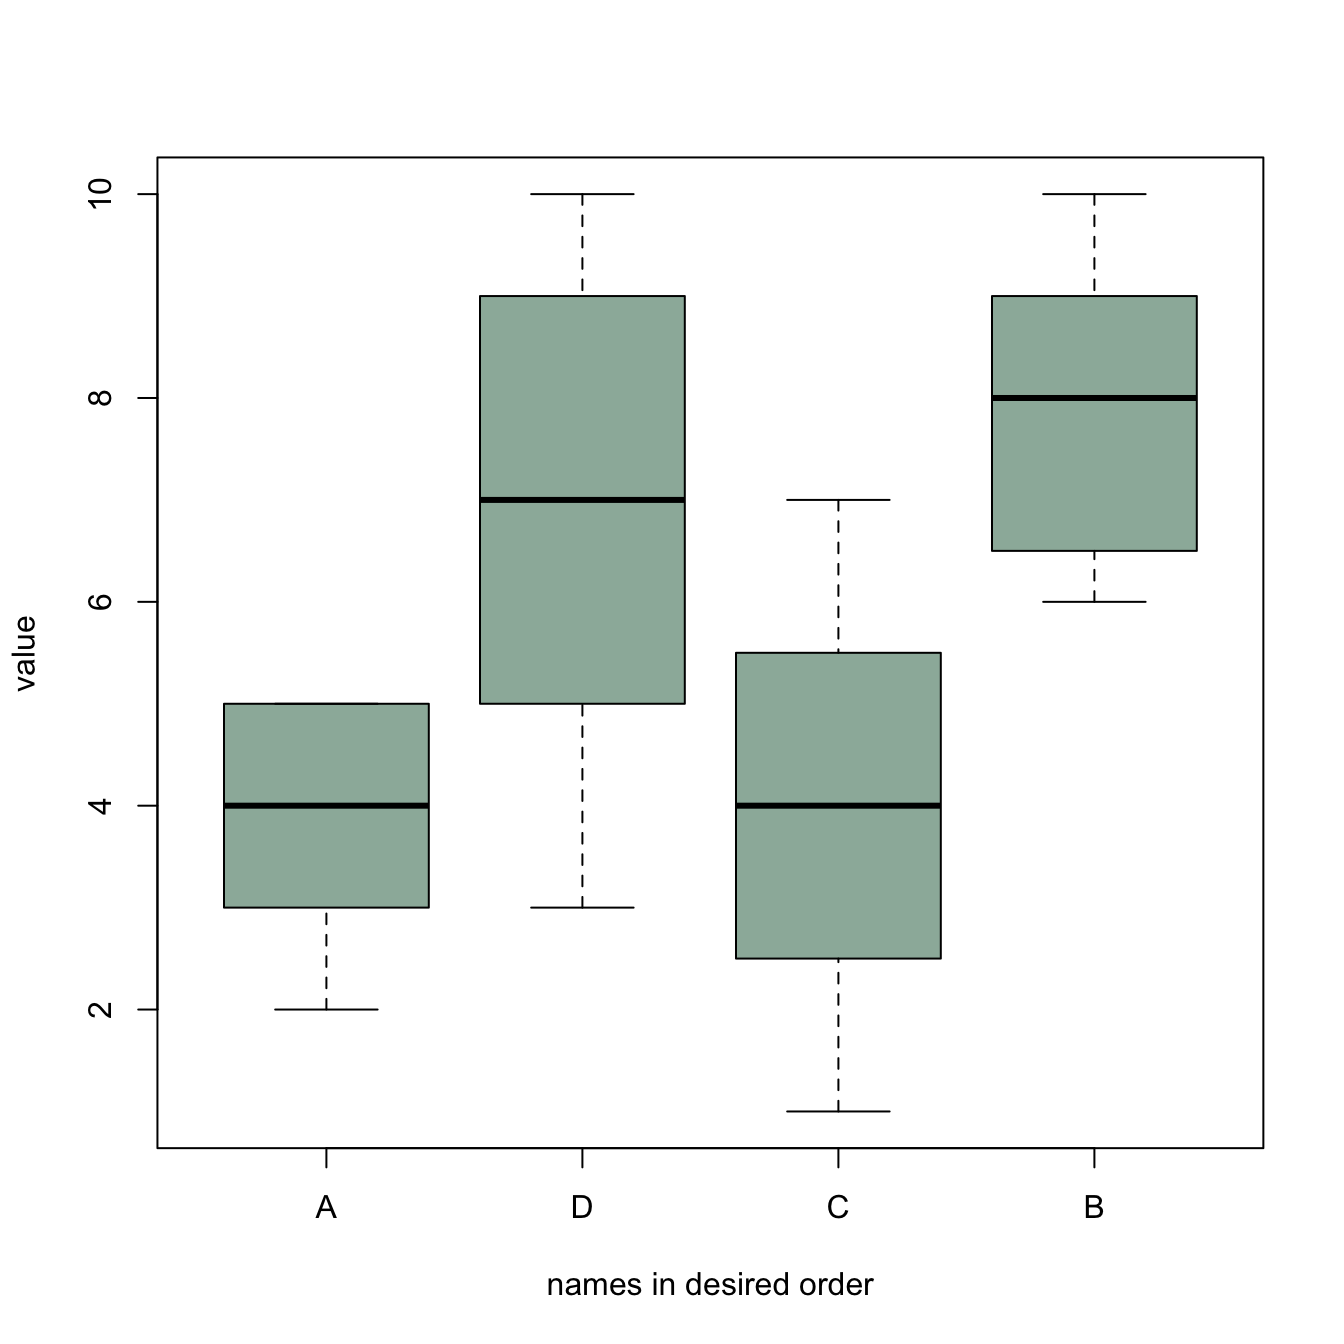
Sometimes, we need to show groups in a specific order (A,D,C,B
here). This can be done by reordering the levels, using the
factor() function.
Note: A complete post about reordering factors is available here.
#Creating data
names <- c(rep("A", 20) , rep("B", 20) , rep("C", 20), rep("D", 20))
value <- c( sample(2:5, 20 , replace=T) , sample(6:10, 20 , replace=T),
       sample(1:7, 20 , replace=T), sample(3:10, 20 , replace=T) )
data <- data.frame(names,value)

# Classic boxplot (A-B-C-D order)
# boxplot(data$value ~ data$names)

# I reorder the groups order : I change the order of the factor data$names
data$names <- factor(data$names , levels=c("A", "D", "C", "B"))

#The plot is now ordered !
boxplot(data$value ~ data$names , col=rgb(0.3,0.5,0.4,0.6) , ylab="value" ,
    xlab="names in desired order")