Marker
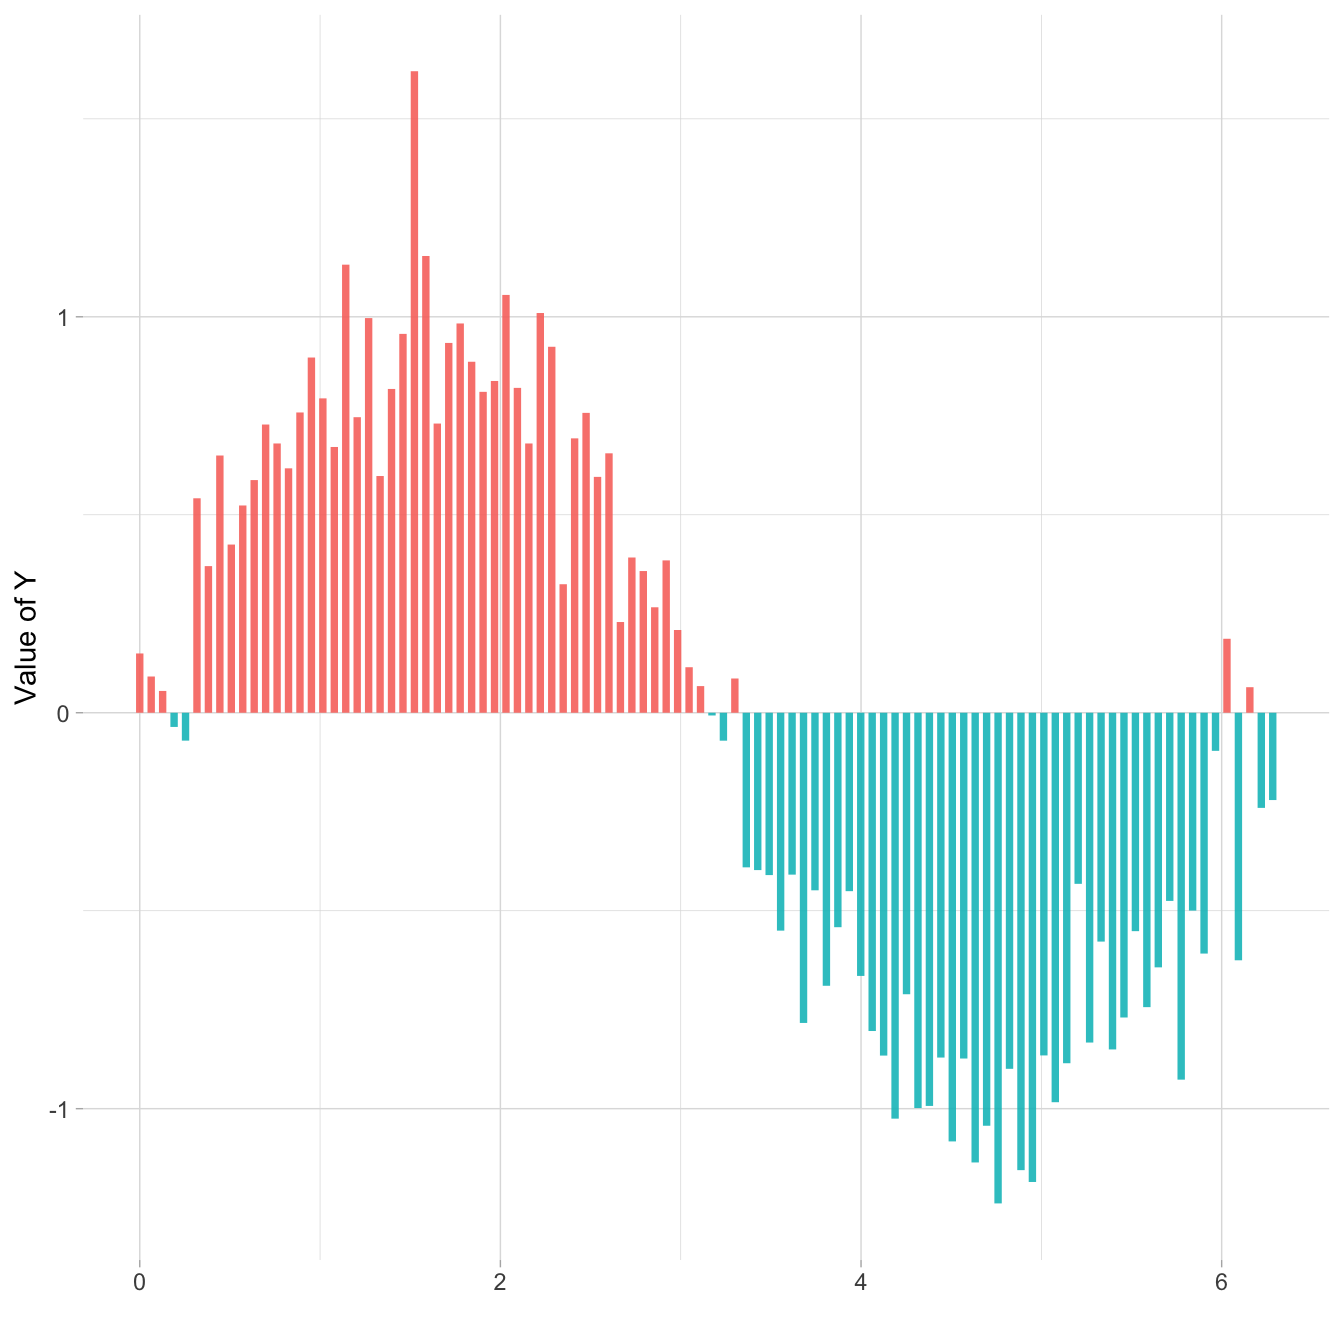
Here is the process to use conditional color on your
ggplot2 chart:
-
add a new column to your dataframe specifying if you are over or
under the threshold (use an
ifelsestatement) - give this column to the
coloraesthetic
# library
library(ggplot2)
library(dplyr)

# Create data (this takes more sense with a numerical X axis)
x <- seq(0, 2*pi, length.out=100)
data <- data.frame(
  x=x,
  y=sin(x) + rnorm(100, sd=0.2)
)

# Add a column with your condition for the color
data <- data %>%
  mutate(mycolor = ifelse(y>0, "type1", "type2"))

# plot
ggplot(data, aes(x=x, y=y)) +
  geom_segment( aes(x=x, xend=x, y=0, yend=y, color=mycolor), size=1.3, alpha=0.9) +
  theme_light() +
  theme(
    legend.position = "none",
    panel.border = element_blank(),
  ) +
  xlab("") +
  ylab("Value of Y")
What’s next
The lollipop chart is one of my favourite. There is so much to do with
it and it is under-utilized in favor of barplot. Visit the
dedicated section for more examples
produced with R, or
data-to-viz
to learn about the available variations and caveats to avoid.


