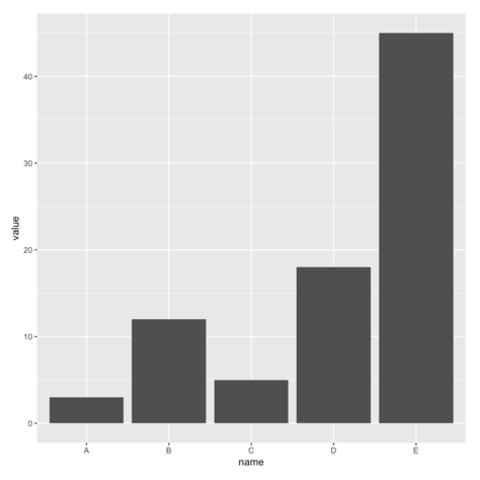
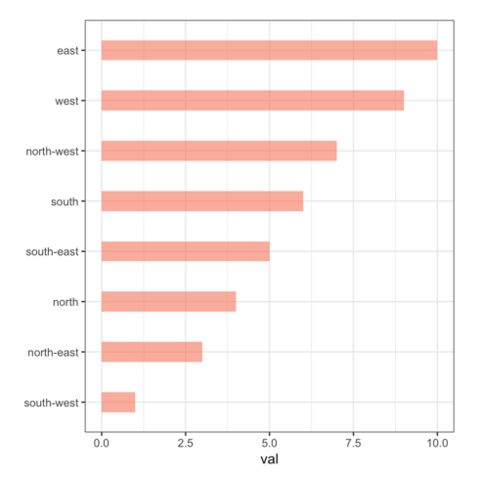
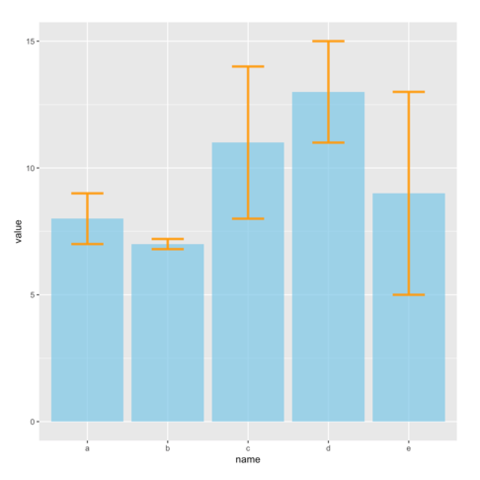
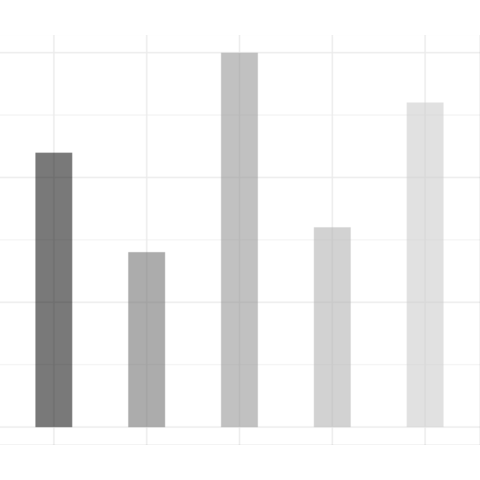
ggplot2 and geom_bar()ggplot2 allows to build barplot thanks to the geom_bar() function. The examples below will guide you through the basics of this tool:
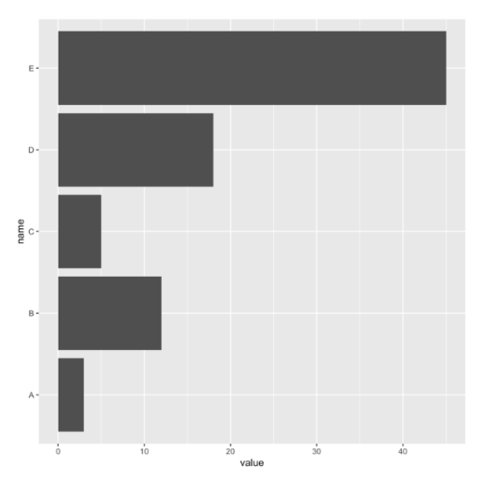
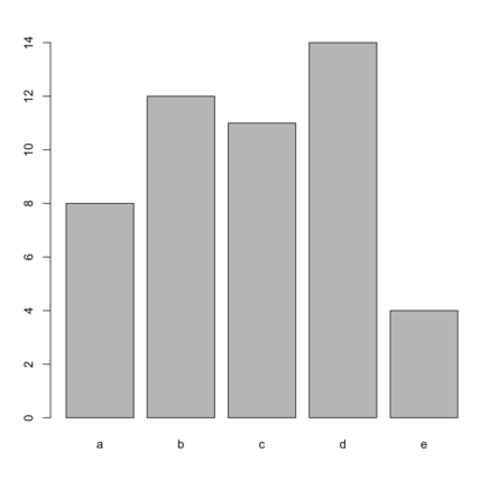
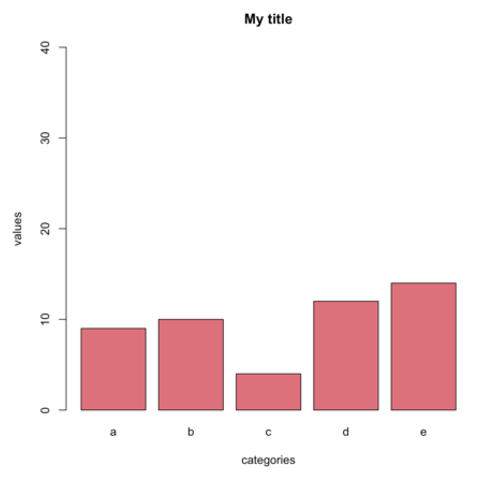
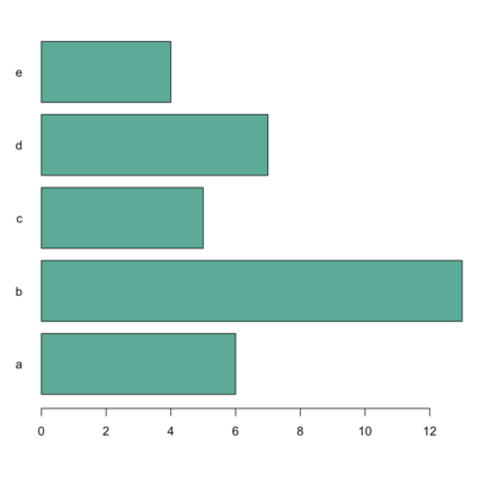
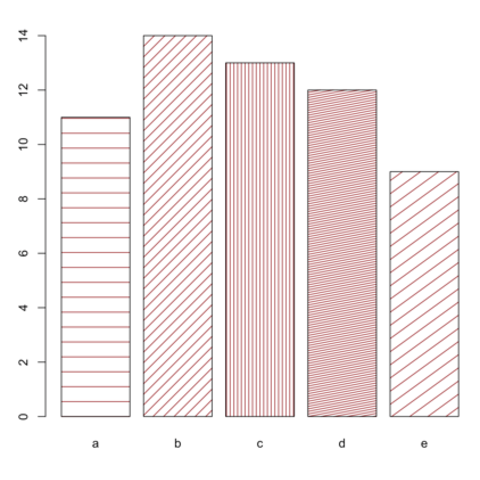
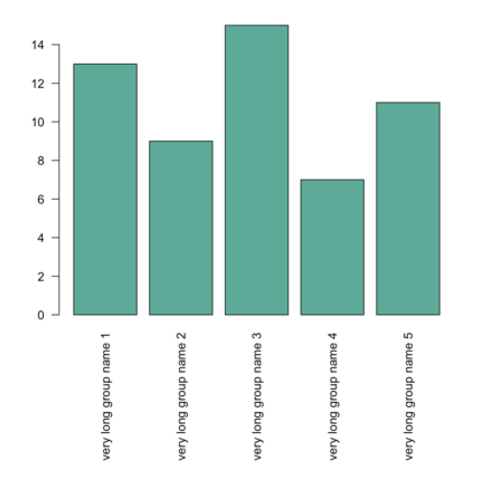
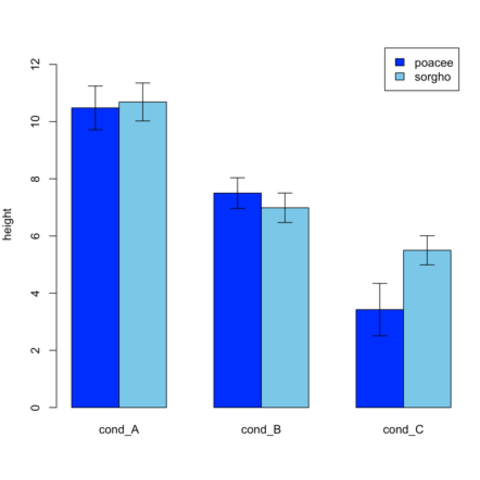
barplot() functionBasic R can build quality barplots thanks to the barplot() function. Here is a list of examples guiding you through the most common customization you will need.
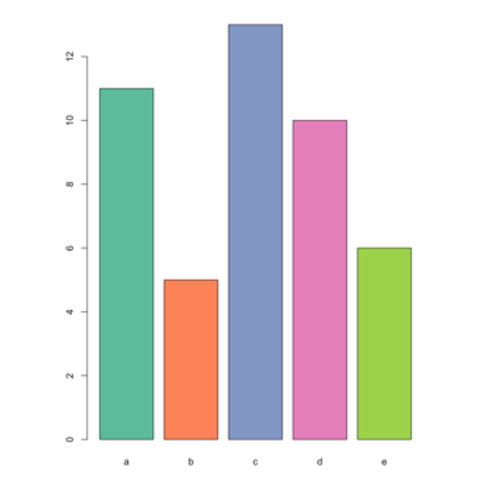
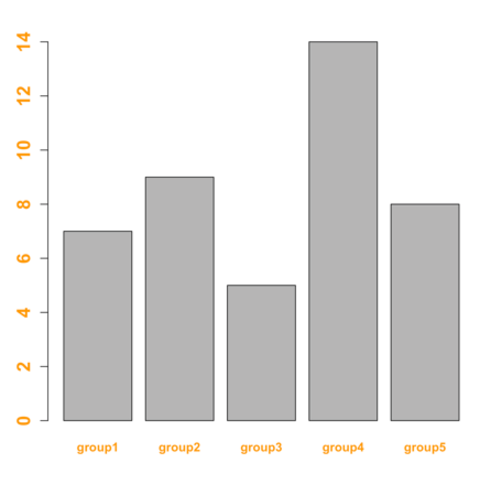
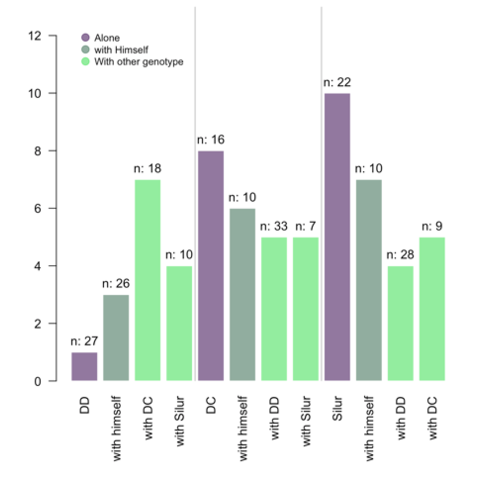
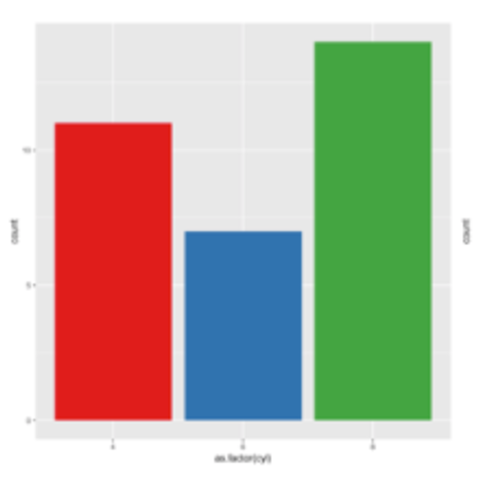
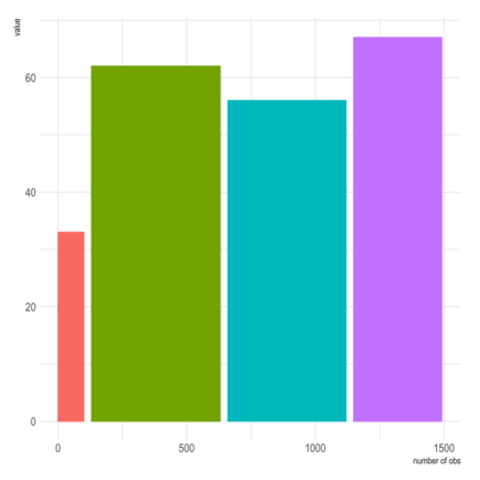
Interactivity is a great way to enhance your graphics, and the ggiraph package makes it very easy! The following graphic shows what an interactive bar chart can look like. Try hovering over it!
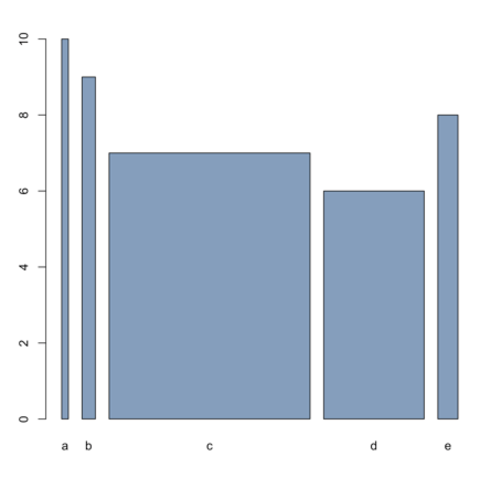
CodeA Mekko chart, also known as a Marimekko chart, is a two-dimensional stacked bar chart where both the height and width of each bar segment represent different data dimensions, making it useful for visualizing categorical data distributions and market share comparisons.
Code