It can be handy to display X axis labels on several lines. For instance, to add the number of values present in each box of a boxplot.
How it works:
-
Change the names of your categories using the
names()function. - Use
\nto start new line -
Increase the distance between the labels and the X axis with the
mgpargument of thepar()function. It avoids overlap with the axis.
Note: mgp is a numeric vector of length 3, which
sets the axis label locations relative to the edge of the inner plot
window. Default value : c(3,1,0). First value : location the labels
(xlab and ylab in plot). Second value : location of the tick-mark
labels (what we want to lower). Third Value : position of the tick
marks
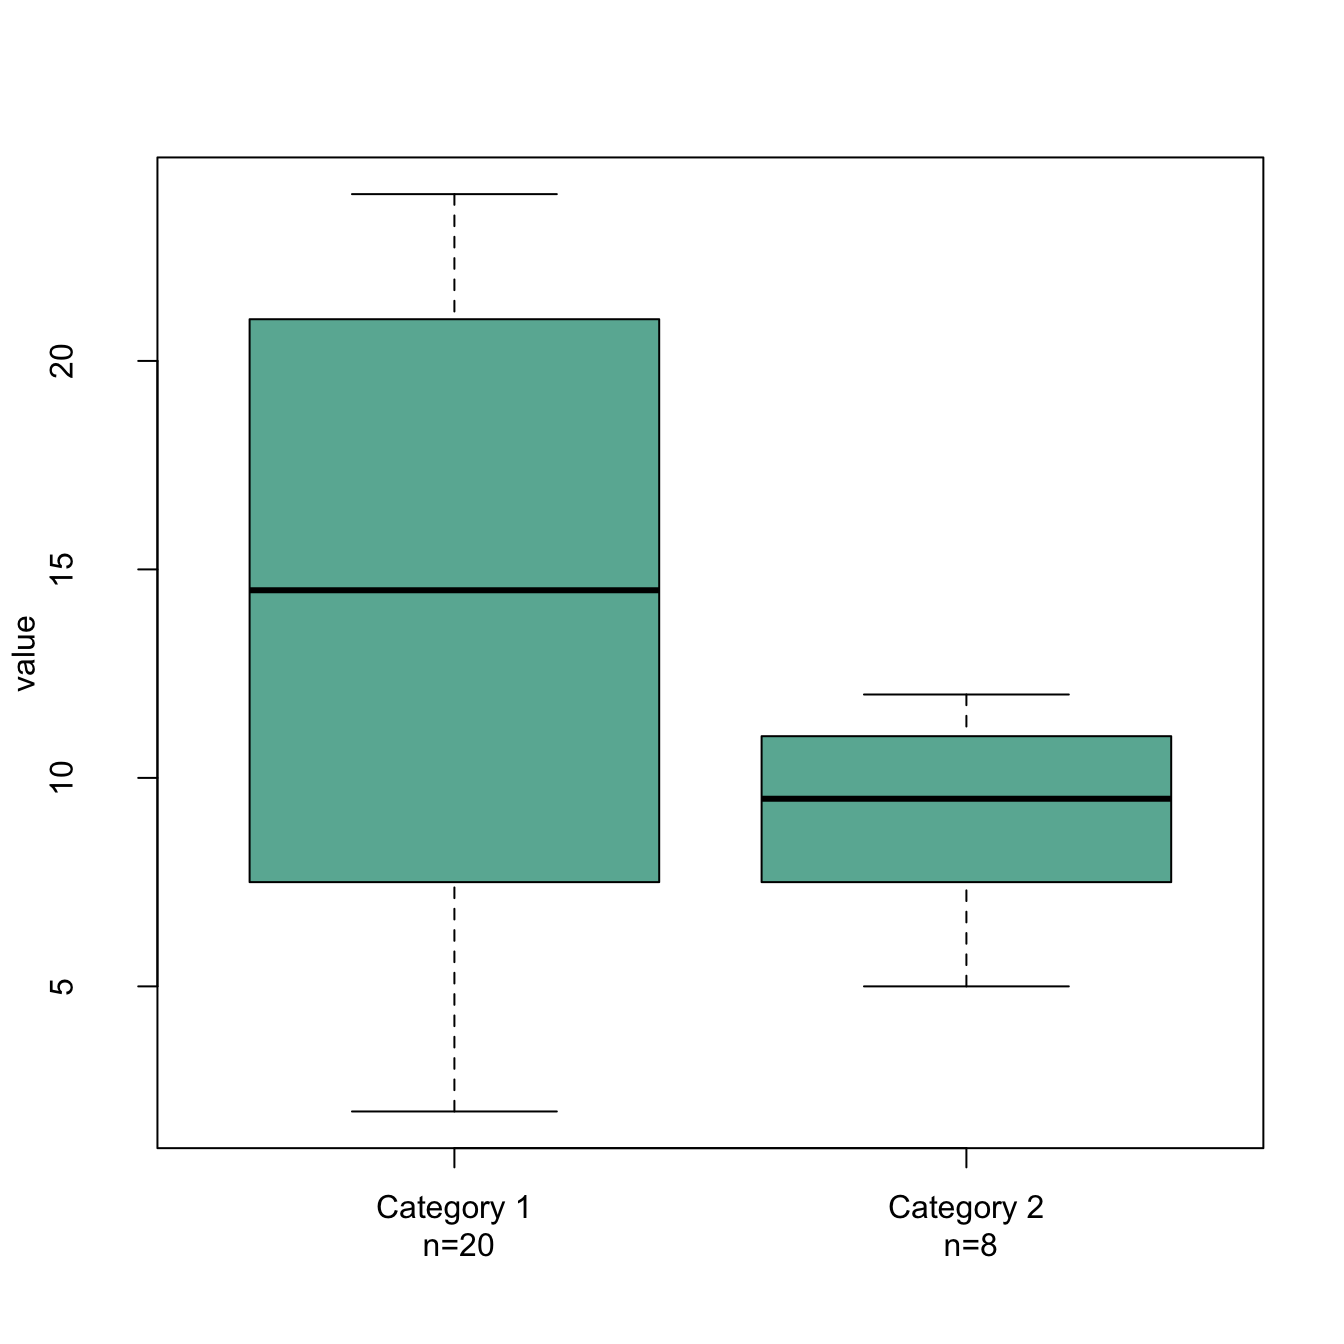
# Create 2 vectors
a <- sample(2:24, 20 , replace=T)
b <- sample(4:14, 8 , replace=T)

# Make a list of these 2 vectors
C <- list(a,b)

# Change the names of the elements of the list :
names(C) <- c(paste("Category 1\n n=" , length(a) , sep=""), paste("Category 2\n n=" , length(b) , sep=""))

# Change the mgp argument: avoid text overlaps axis
par(mgp=c(3,2,0))

# Final Boxplot
boxplot(C , col="#69b3a2" , ylab="value" )