This example demonstrates how to color parts of the
histogram. First of all, the
hist function must be called without plotting the
result using the plot=F option. It allows to store the
position of each bin in an object (my_hist here).
Those bin borders are now available in the $breaks slot
of the object, what allows to build a color vector using
ifelse statements. Finally, this color vector can be
used in a plot call.
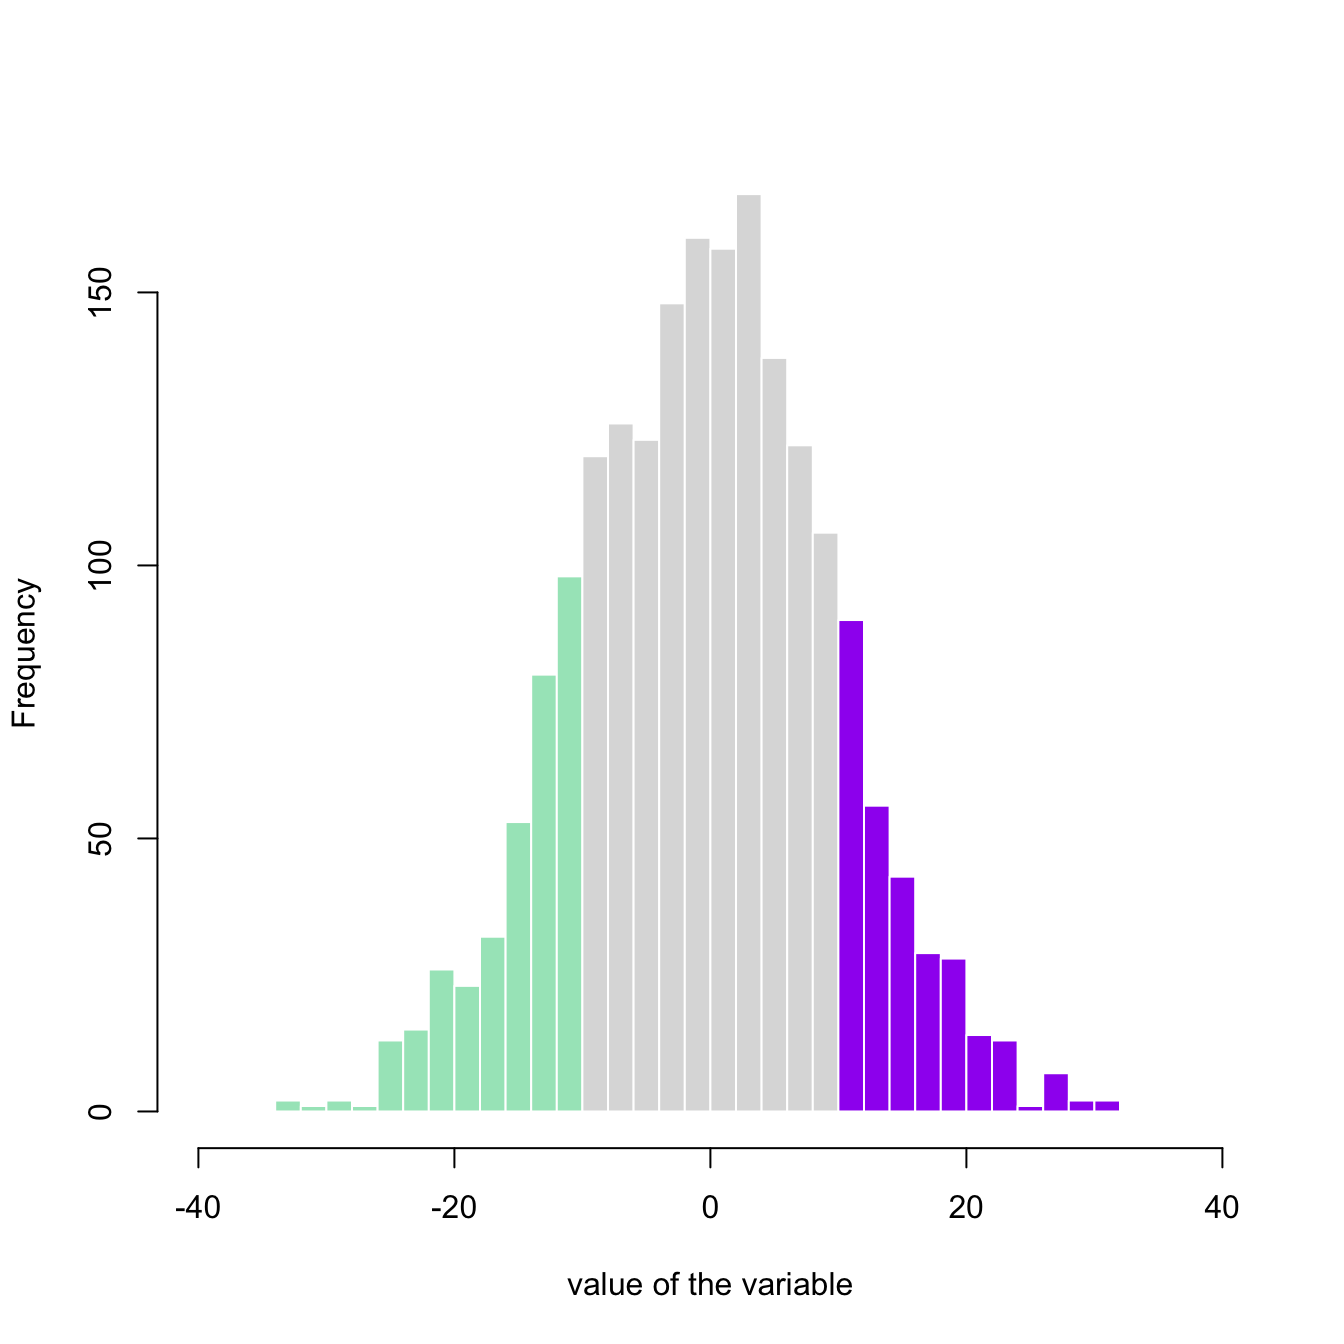
# Create data
my_variable=rnorm(2000, 0 , 10)

# Calculate histogram, but do not draw it
my_hist=hist(my_variable , breaks=40  , plot=F)

# Color vector
my_color= ifelse(my_hist$breaks < -10, rgb(0.2,0.8,0.5,0.5) , ifelse (my_hist$breaks >=10, "purple", rgb(0.2,0.2,0.2,0.2) ))

# Final plot
plot(my_hist, col=my_color , border=F , main="" , xlab="value of the variable", xlim=c(-40,40) )