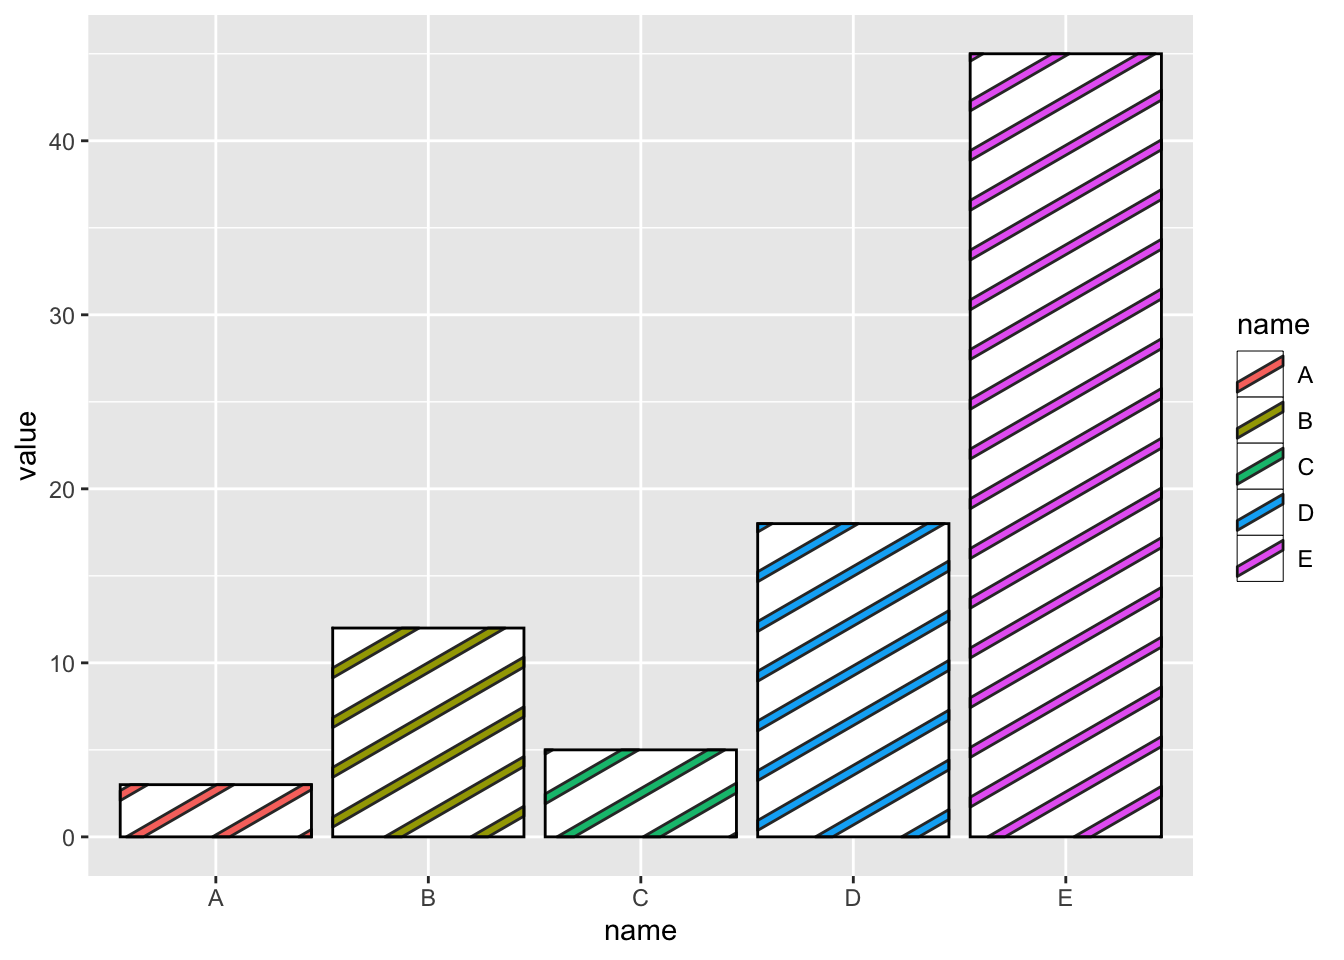
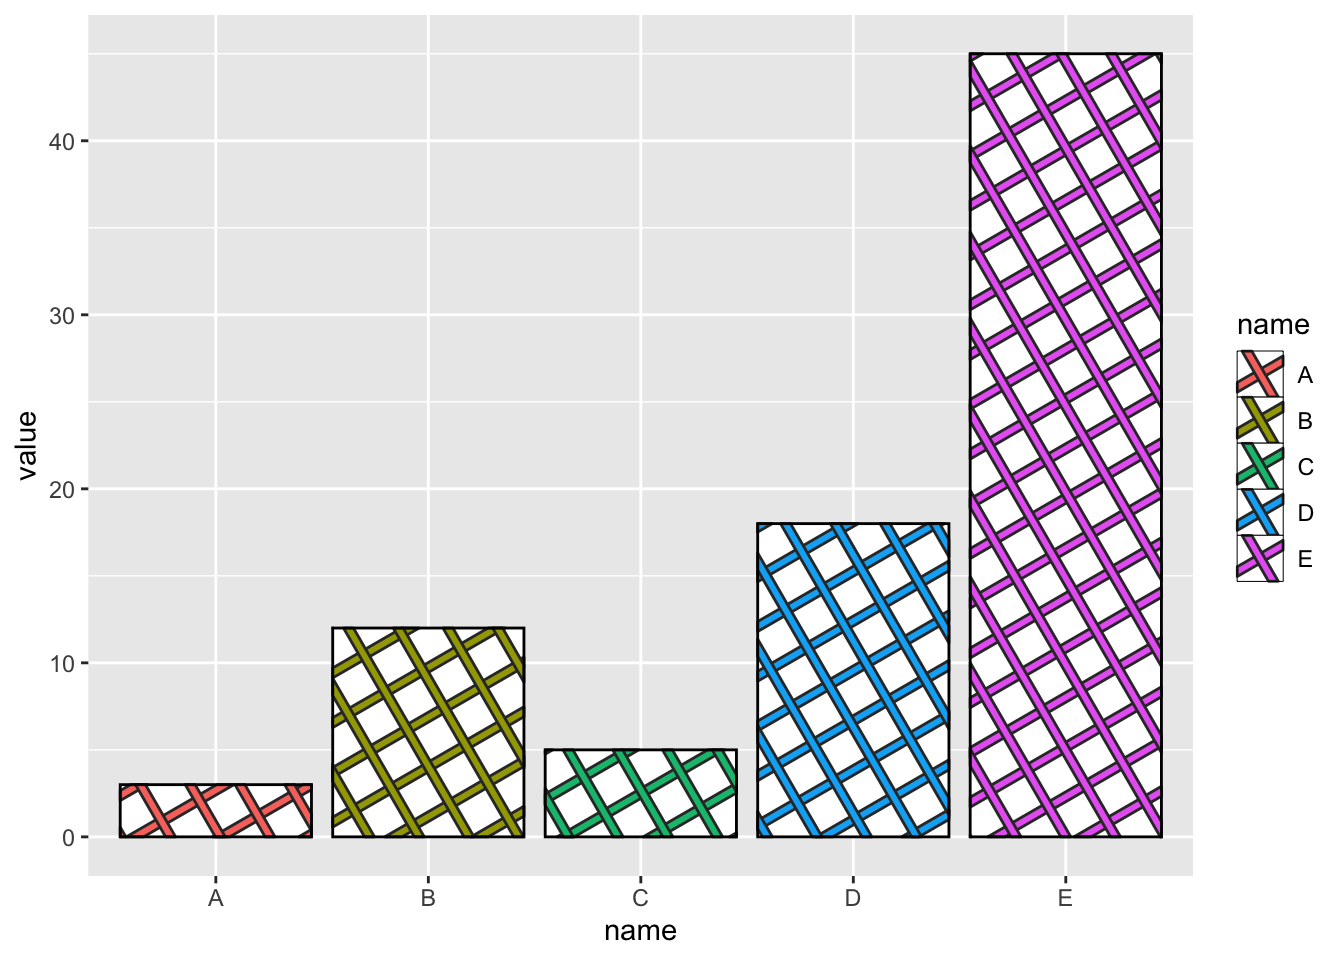
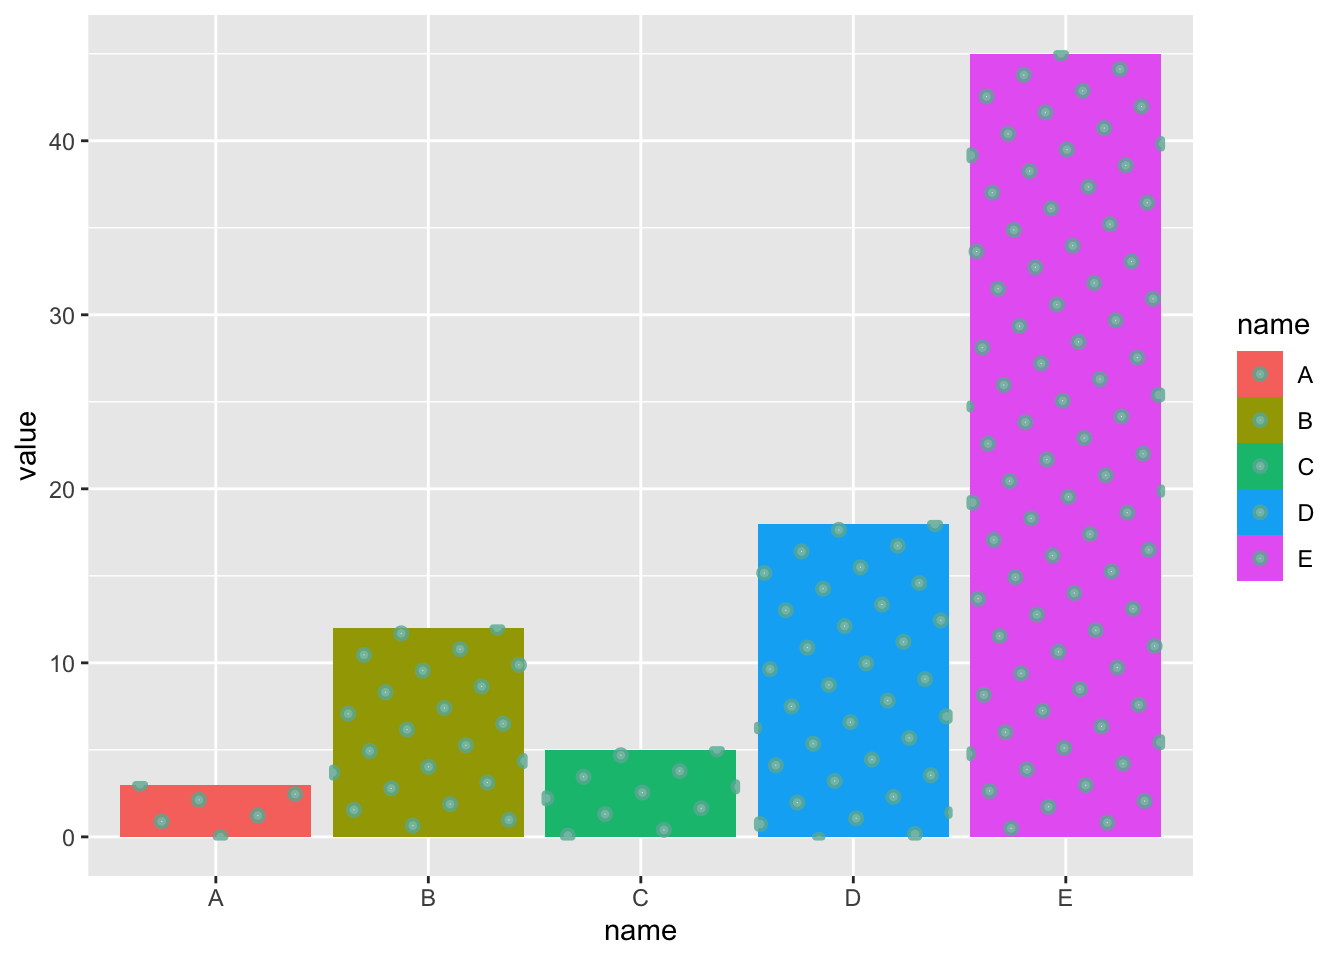
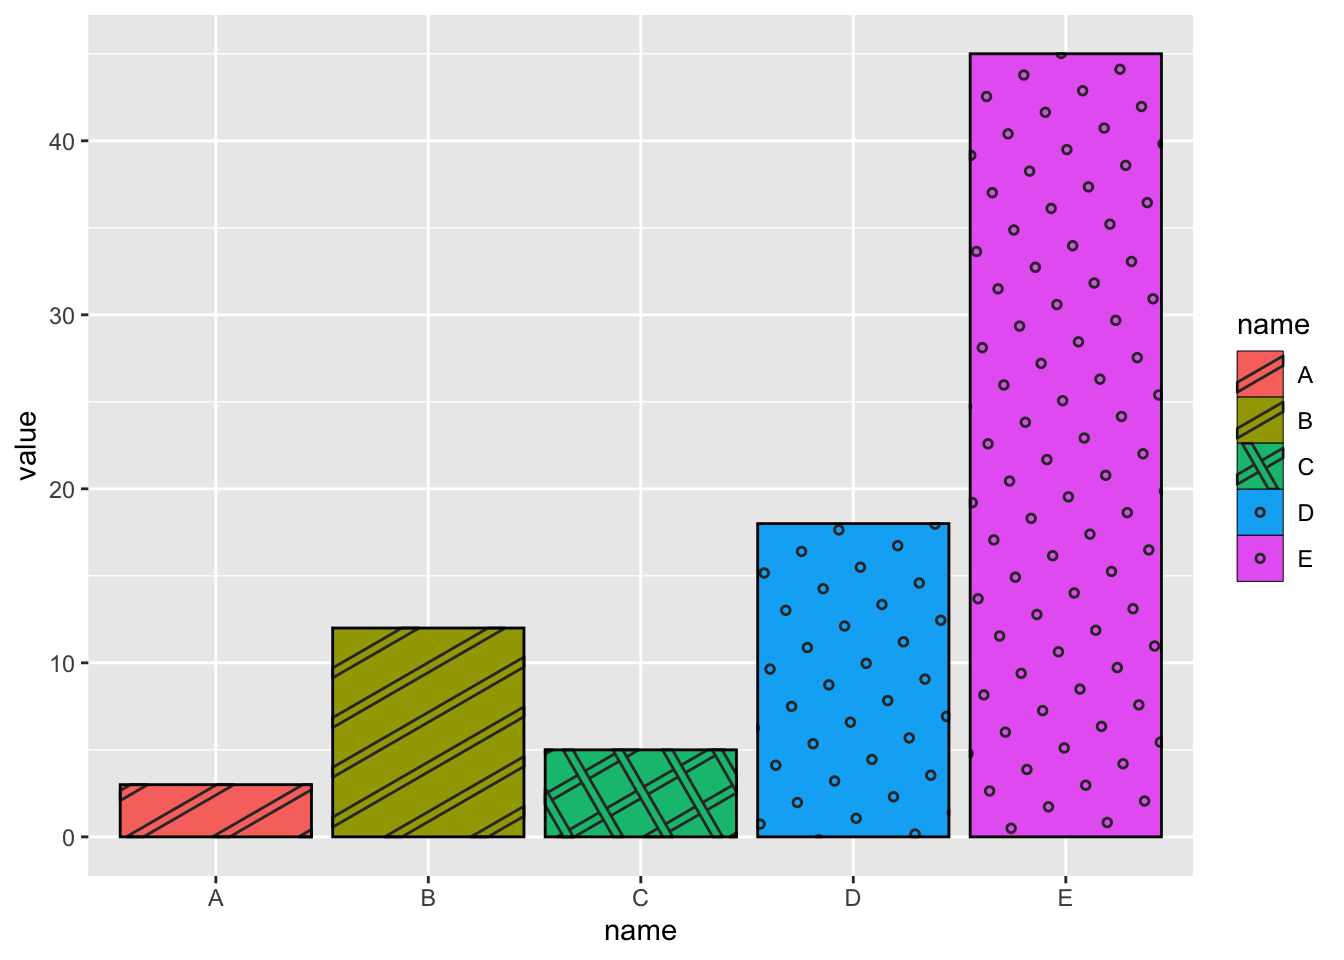
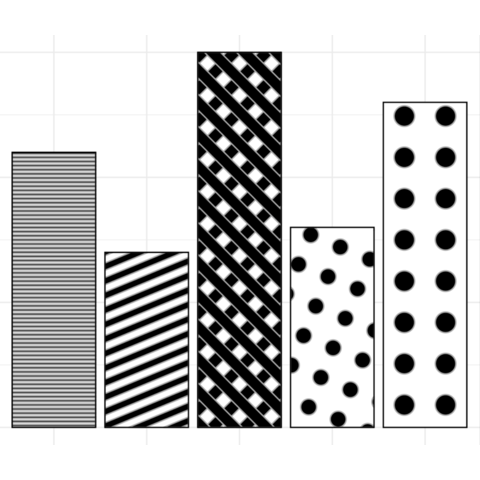
Filled areas with geometric and image-based patterns


The ggpattern package in R is an extension of the ggplot2 package, designed to add pattern aesthetics to your ggplot2 visualizations.
This post showcases the key features of ggpattern and provides a set of graph examples using the package.

Documentation

{ggpattern}

Quick start


The ggpattern package in R is an extension of the ggplot2 package, designed to add pattern aesthetics to your ggplot2 visualizations.

It allows you to add patterns like stripes, crosses, custom images and more to your ggplot2 plots, making your visualizations more informative and engaging.

✍️ author → Mike FC

📘 documentationgithub

⭐️ more than 500 stars on github

This package can be especially useful if you need to publish some black and white content.

# libs
library(ggplot2)
library(ggpattern)

# Create data
data <- data.frame(
  name=c("A","B","C","D","E") ,  
  value=c(3, 12, 5, 18, 45)
  )

# Barplot
ggplot(data, aes(x=name, y=value)) + 
  geom_col_pattern(
    aes(pattern_fill = name), 
    pattern = 'stripe',
    fill    = 'white',
    colour  = 'black'
  )

Installation


Getting started with ggpattern is straightforward.

First, ensure you have ggplot2 installed. Then, you can install ggpattern directly from CRAN using the install.packages function:

install.packages("ggpattern", repos = "https://cinc.rud.is")

Basic usage


The ggpattern package comes with a variety of pattern aesthetics that can be easily integrated into your ggplot2 visualizations.

Let’s take an example with the geom_col_pattern() aesthetics. It does pretty much the same task as the geom_col() aesthetics of ggplot2 that is used for bar charts.

But it adds options to use some patterns into rectangles.

The aesthetics comes with a number of options described in the next section. For each, you have to decide:

# Barplot
ggplot(data, aes(x=name, y=value)) + 
  geom_col_pattern(
    aes(pattern_fill = name), 
    pattern = 'crosshatch',
    fill    = 'white',
    colour  = 'black'
  )

Customization


It is possible to customize pretty much everything on the pattern you are building.

Type help(geom_col_pattern) to get some more details on all the available options!

# Bar chart using ggpattern with comments
ggplot(data, aes(x=name, y=value, fill= name)) + # Usual ggplot2 call, "name" for the x axis, "value" for the y axis
  geom_col_pattern(
    pattern = "circle",
    pattern_alpha = 0.8,
    pattern_fill = "white",
    pattern_colour  = '#69b3a2',
    pattern_size = 1.3
  )

Mapping pattern to data


You can map the pattern features to the data in use.

For instance, the following example use a very different look for each group of the dataset. To do so, the arguments described above are placed inside the aes() call:

# Bar chart using ggpattern with comments
ggplot(data, aes(x=name, y=value)) + # Usual ggplot2 call, "name" for the x axis, "value" for the y axis
  geom_col_pattern(
    aes(
      pattern_fill = name,
      fill= name,
      pattern = name,
    ),  
    colour  = 'black'
  )

Other aesthetics


Several other aesthetics are available, allowing to fill any kind of chart types with pattern. Names are always matching the original ggplot2 names.

To put it in a nutshell:

And many more are on the list. Here is an overview of other examples in the gallery using the ggpattern library:


Contact

This document is a work by Yan Holtz. Any feedback is highly encouraged. You can fill an issue on Github, drop me a message on Twitter, or send an email pasting yan.holtz.data with gmail.com.

Github Twitter