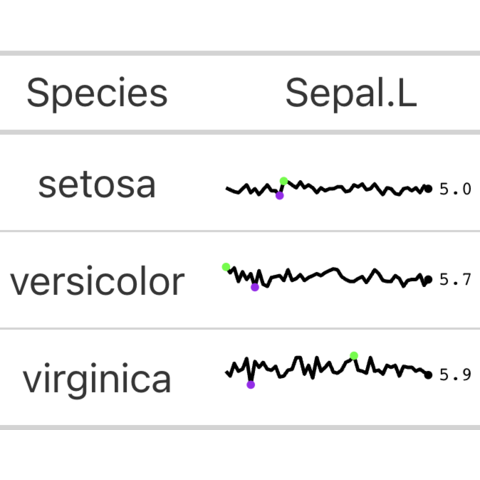
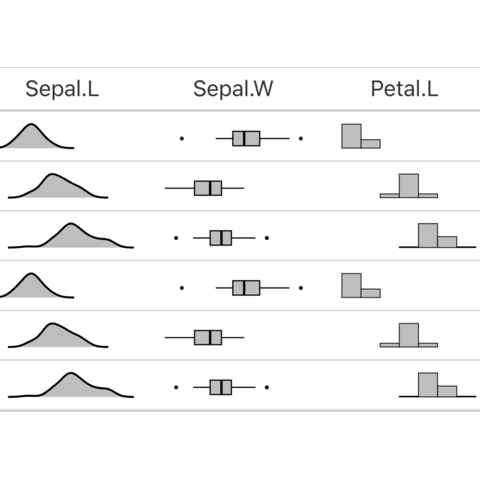
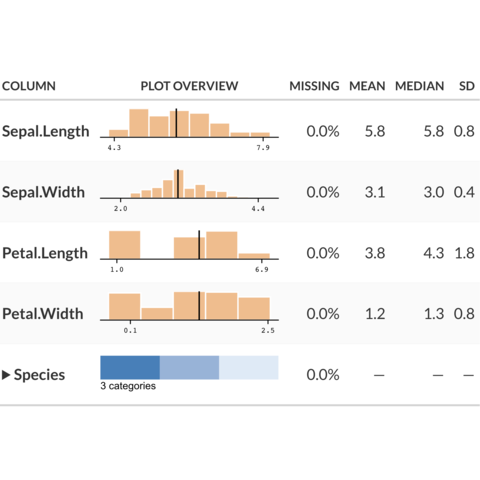
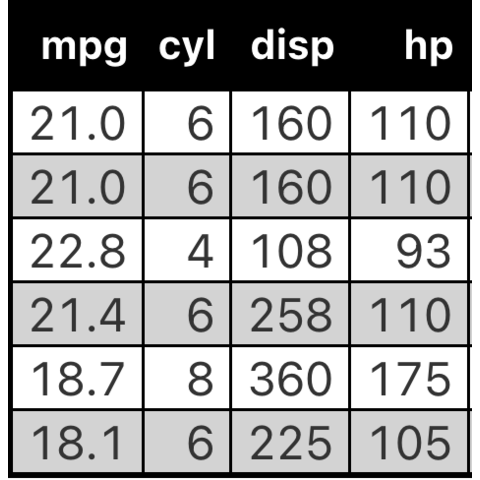
Enhance gt tables with gtExtras


The gtExtras package in R is an extension of the gt package who provides lots of useful and easy-to-use functions that make gt tables even better!
This post showcases the key features of gtExtras and provides a set of table examples using the package.

Documentation

{gtExtras}

Quick start


The gtExtras package in R is an extension of the gt package, designed to extend what can be done with gt with more than 60 new functions and features.

It offers several table themes, tools for plotting inside a table and other features such as color gradients for columns and rows. In total, it’s more than 60 functions that gtExtras has to offer!

✍️ author β†’ Thomas Mock

πŸ“˜ documentation β†’ github

⭐️ more than 100 stars on github

Installation


To get started with gtExtras, you can install it directly from CRAN using the install.packages function:

install.packages("gtExtras")

Basic usage


The gtExtras package relies on the gt package, which means that we need to use the gt() function:

library(gtExtras)

head(iris) %>% 
  gt() %>% 
  gt_theme_excel()
Sepal.Length Sepal.Width Petal.Length Petal.Width Species
5.1 3.5 1.4 0.2 setosa
4.9 3.0 1.4 0.2 setosa
4.7 3.2 1.3 0.2 setosa
4.6 3.1 1.5 0.2 setosa
5.0 3.6 1.4 0.2 setosa
5.4 3.9 1.7 0.4 setosa

Key features


β†’ Theming

gtExtras offers a wide variety of themes that require just one line of code to use:

Example:

library(gtExtras)

head(iris) %>% 
  gt() %>% 
  gt_theme_dot_matrix()
Sepal.Length Sepal.Width Petal.Length Petal.Width Species
5.1 3.5 1.4 0.2 setosa
4.9 3.0 1.4 0.2 setosa
4.7 3.2 1.3 0.2 setosa
4.6 3.1 1.5 0.2 setosa
5.0 3.6 1.4 0.2 setosa
5.4 3.9 1.7 0.4 setosa


β†’ Color rows

You can use a color palette for your cells with the gt_color_rows() function, and even choose palette from other package like in the following example.

In the palette argument, you can also specify a vector of colors and it will automatically generate the palette. For example palette=c("blue", "red") will generate a palette starting from blue to red.

Warning: if you select a non-numerical column in gt_color_rows(), an error will occur, as it is impossible to define which color level to choose for a categorical value.

Example:

library(gtExtras)

head(iris) %>%
  gt() %>%
  gt_color_rows(
    1:4, # column 1,2,3 and 4
    palette = "RColorBrewer::Spectral"
    )
Sepal.Length Sepal.Width Petal.Length Petal.Width Species
5.1 3.5 1.4 0.2 setosa
4.9 3.0 1.4 0.2 setosa
4.7 3.2 1.3 0.2 setosa
4.6 3.1 1.5 0.2 setosa
5.0 3.6 1.4 0.2 setosa
5.4 3.9 1.7 0.4 setosa


β†’ Highlight specific row

The gt_highlight_rows() function allows to highlight specific rows with a background color and by putting text in bold.

Example:

library(gtExtras)

head(iris, 6) %>%
  gt() %>%
  gt_highlight_rows(
    rows = c(1, 4), # rows to highlight
    target_col = 3, # which column to focus on
    bold_target_only = TRUE, # highlight target column 
    fill='darkred', # background color
    font_color = "#000051", # text color,
    alpha=0.5, # controls color opacity
  )
Sepal.Length Sepal.Width Petal.Length Petal.Width Species
5.1 3.5 1.4 0.2 setosa
4.9 3.0 1.4 0.2 setosa
4.7 3.2 1.3 0.2 setosa
4.6 3.1 1.5 0.2 setosa
5.0 3.6 1.4 0.2 setosa
5.4 3.9 1.7 0.4 setosa


β†’ Plotting

gtExtras has multiple functions for plotting inside cells: gt_plt_sparkline() for a line chart, gt_plt_dist() for distribution charts (density, boxplot, histogram) and lots of other!

Example with gt_plt_dist():

library(gtExtras)
library(dplyr)

iris %>%
  group_by(Species) %>%
  summarize(SL_data = list(Sepal.Length)) %>%
  gt() %>%
  gt_plt_dist(SL_data)
Species SL_data
setosa
versicolor
virginica


Contact

This document is a work by Yan Holtz. Any feedback is highly encouraged. You can fill an issue on Github, drop me a message on Twitter, or send an email pasting yan.holtz.data with gmail.com.

Github Twitter