The
ggridges package.In term of code, a ridgeline chart is simply a set of many density plots. Thus, starting by learning the basics of density chart is probably a good idea.
Best examples
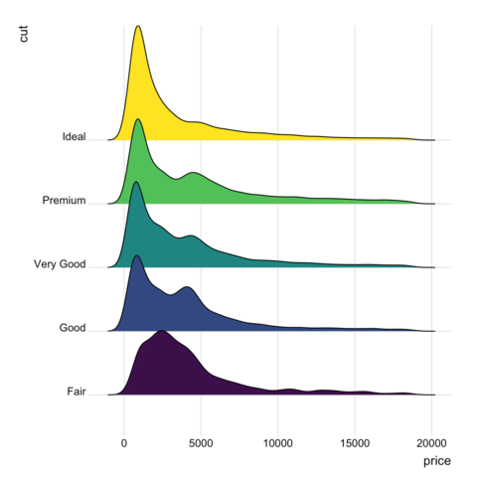
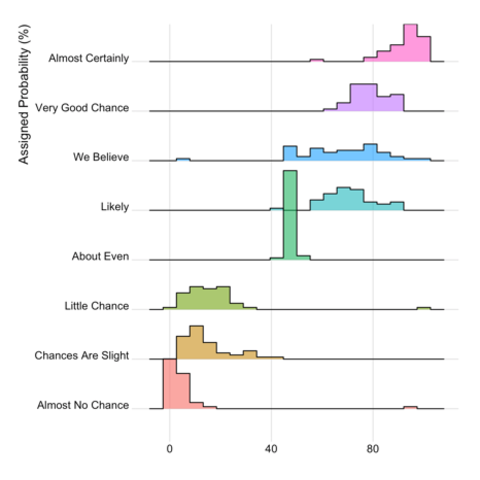
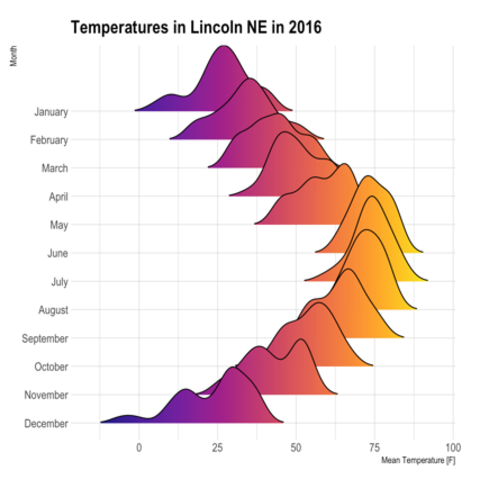
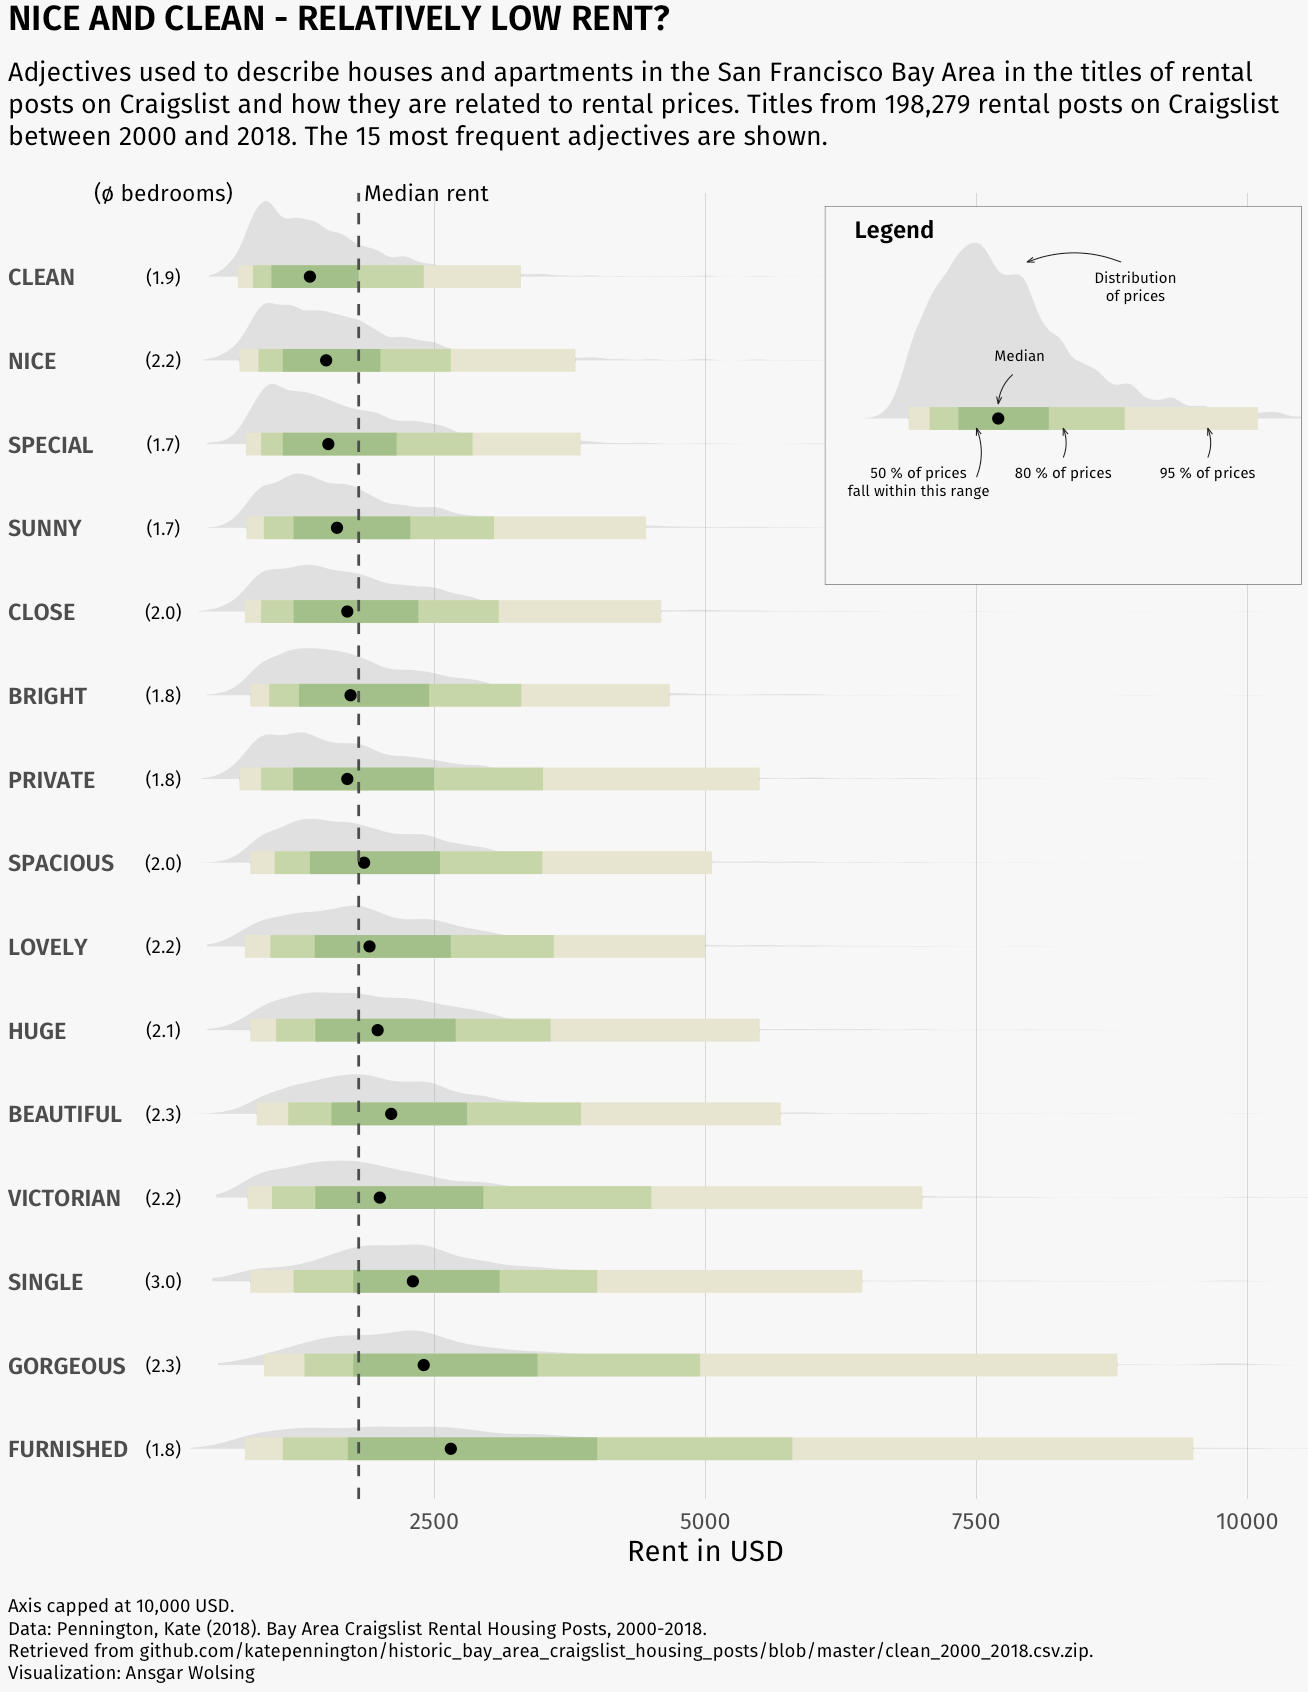
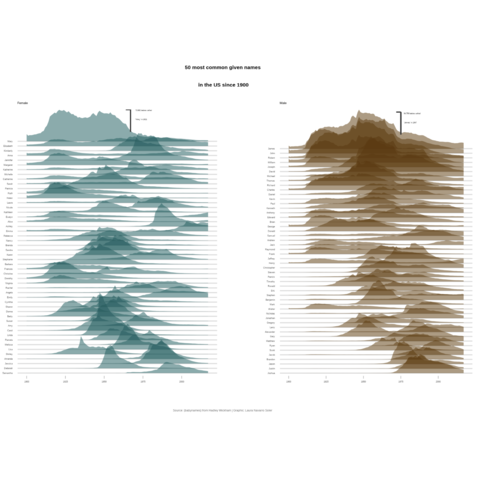
The gallery tries to find and show the best examples of ridgeline charts, and how to reproduce them. Here are some examples:
