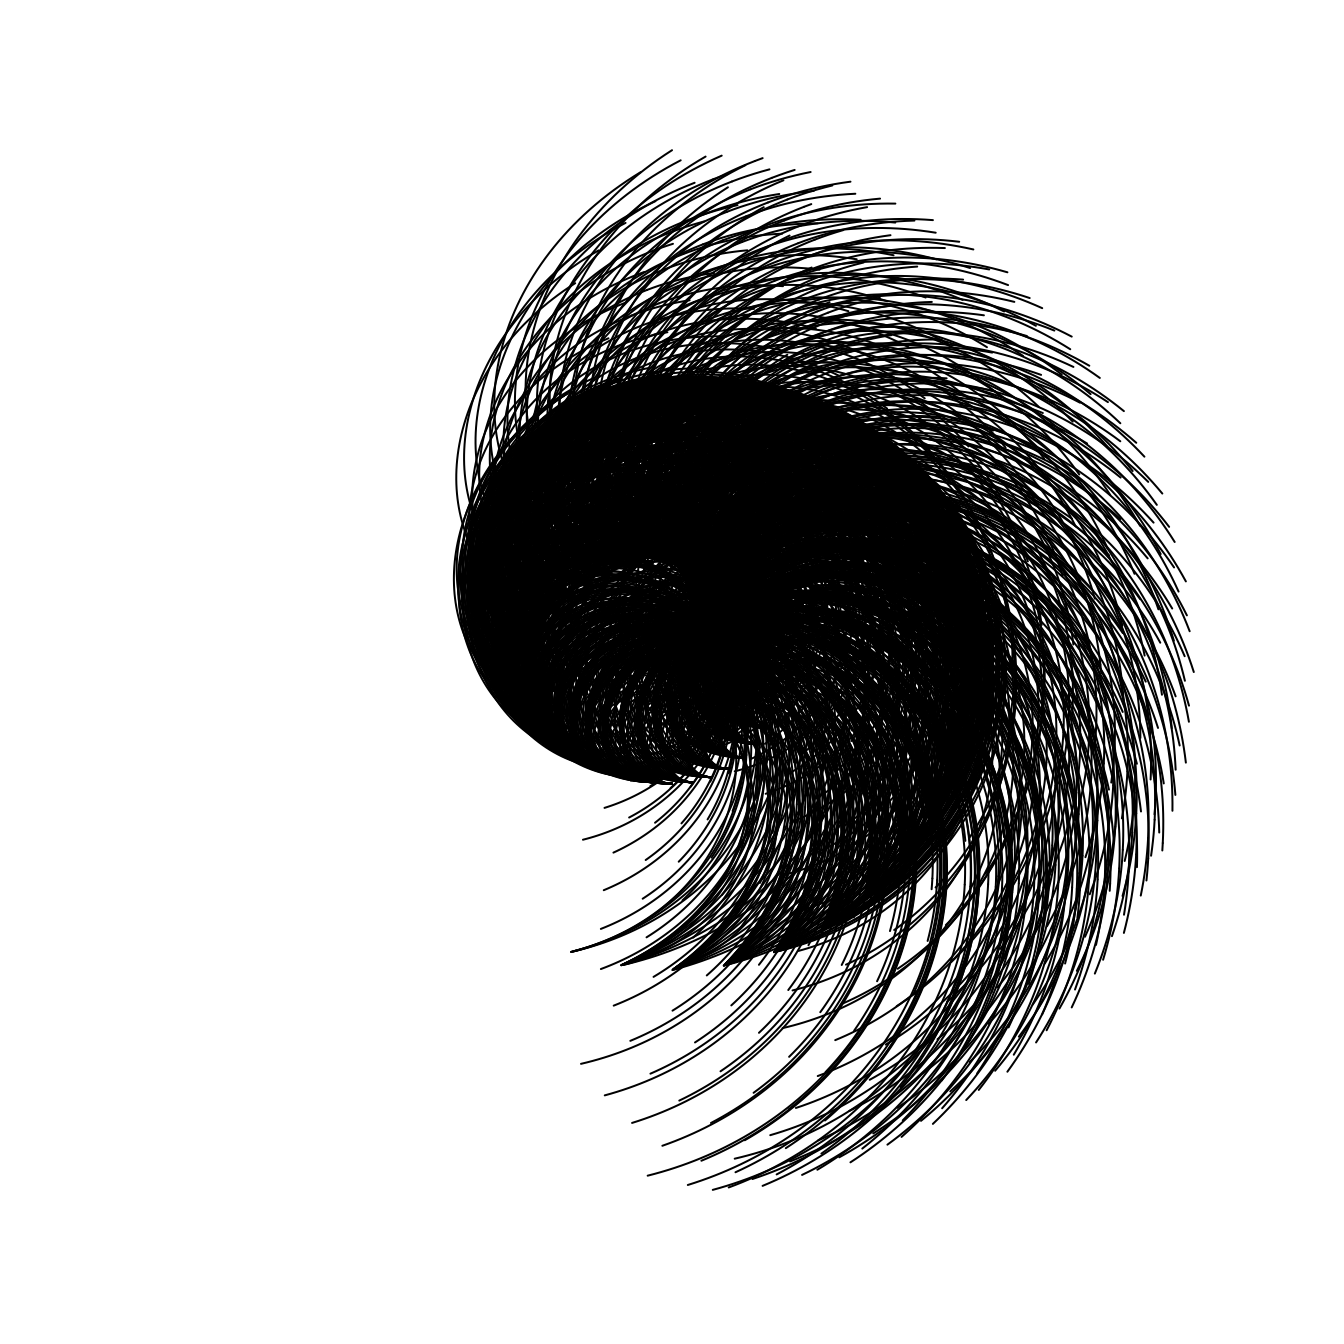
Thanks to Christophe Cariou for this ” R snail”, also available on the accidental art twitter page.
par(mfrow=c(1,1),mar=c(0,0,0,0),oma=c(1,1,1,1))
plot(0,0,type="n", xlim=c(-2,32), ylim=c(3,27),
    xaxs="i", yaxs="i", axes=FALSE, xlab=NA, ylab=NA,
    asp=1)

for (j in 0:35) {
for (i in 0:35) {

    R <- 8
    alpha <- j*10
    X <- 15+R*cos(alpha/180*pi)
    Y <- 15+R*sin(alpha/180*pi)

    r <- 3
    beta <- i*10
    x <- 15+r*cos(beta/180*pi)
    y <- 15+r*sin(beta/180*pi)

    d1 <- sqrt((X-x)^2+(Y-y)^2)
    xc <- x
    yc <- y

  n <- 180-atan((Y-y)/(X-x))/pi*180

    alpha2 <- -(0:n)
    theta <- alpha2/180*pi

    b <- d1/(n/180*pi)
    r <- b*theta

    x1 <- xc+r*cos(theta)
    y1 <- yc+r*sin(theta)

    lines(x1,y1, col="black")

    }
}