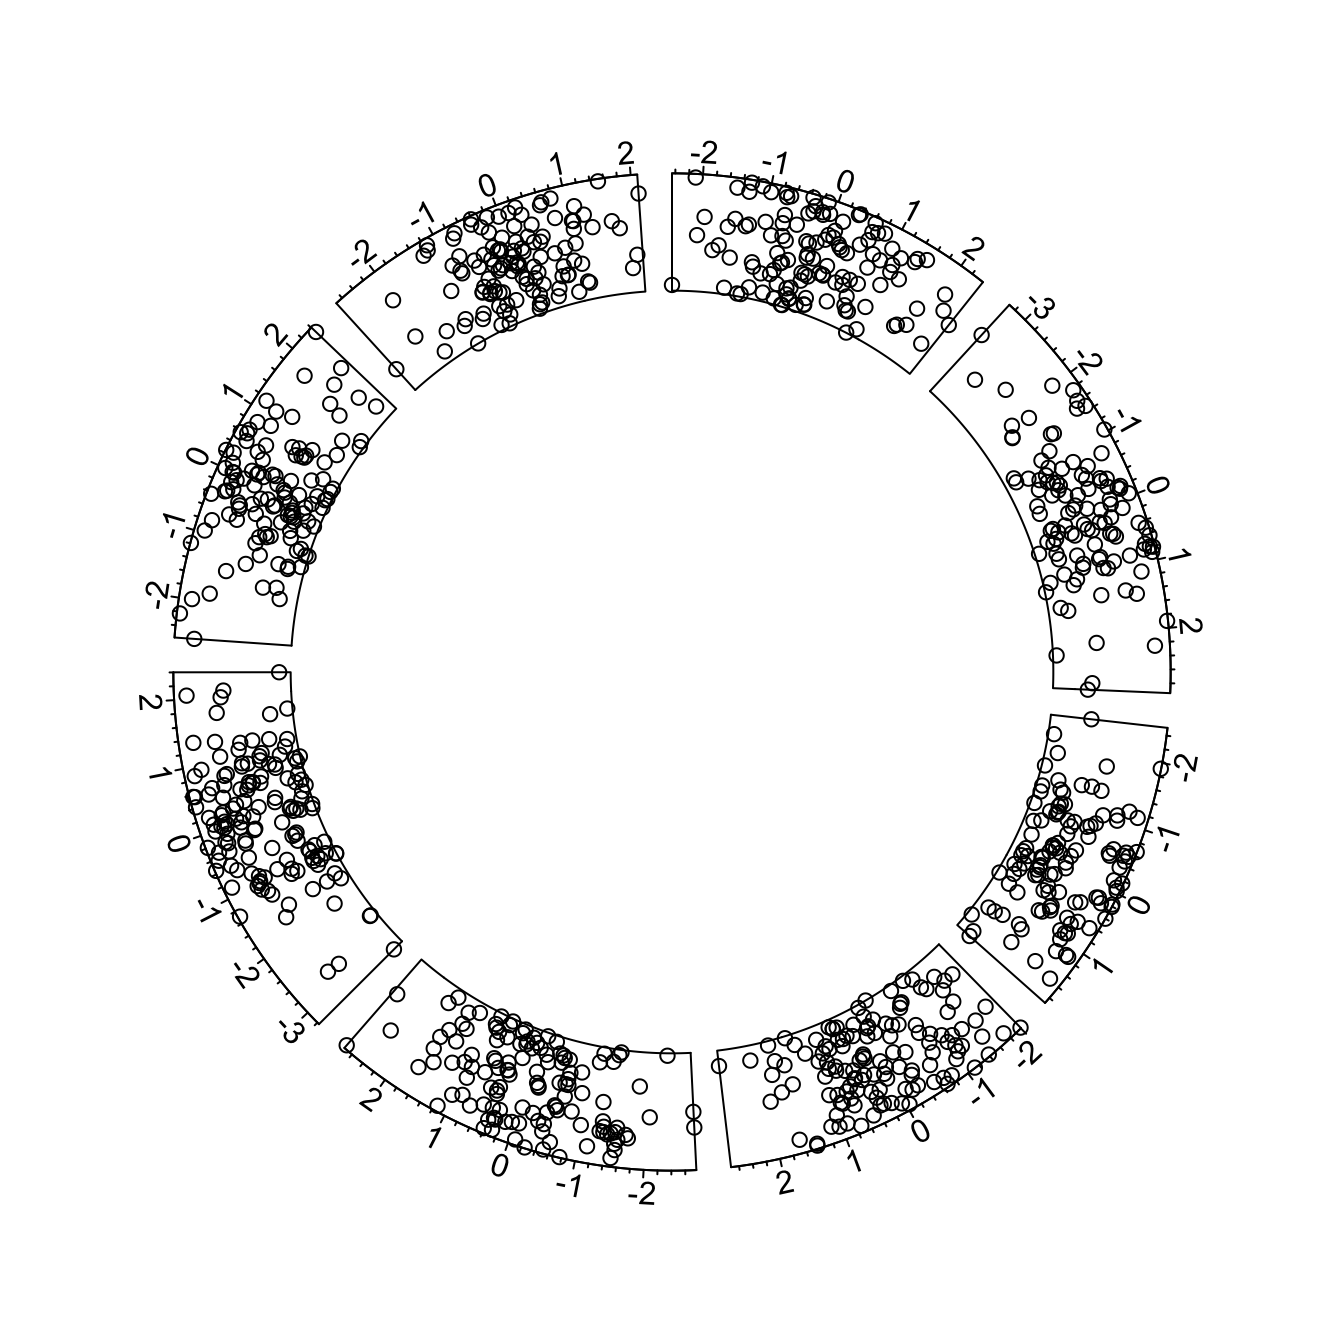
Most basic circular chart
Let’s remind how to build a basic circular chart with the
circlize package.
This is extensively described in chart #224.
# Upload library
library(circlize)

# Create data
data = data.frame(
    factor = sample(letters[1:8], 1000, replace = TRUE),
    x = rnorm(1000),
    y = runif(1000)
    )

# Step1: Initialise the chart giving factor and x-axis.
circos.initialize( factors=data$factor, x=data$x )

# Step 2: Build the regions.
circos.trackPlotRegion(factors = data$factor, y = data$y, panel.fun = function(x, y) {
    circos.axis()
    })

# Step 3: Add points
circos.trackPoints(data$factor, data$x, data$y)
Customization
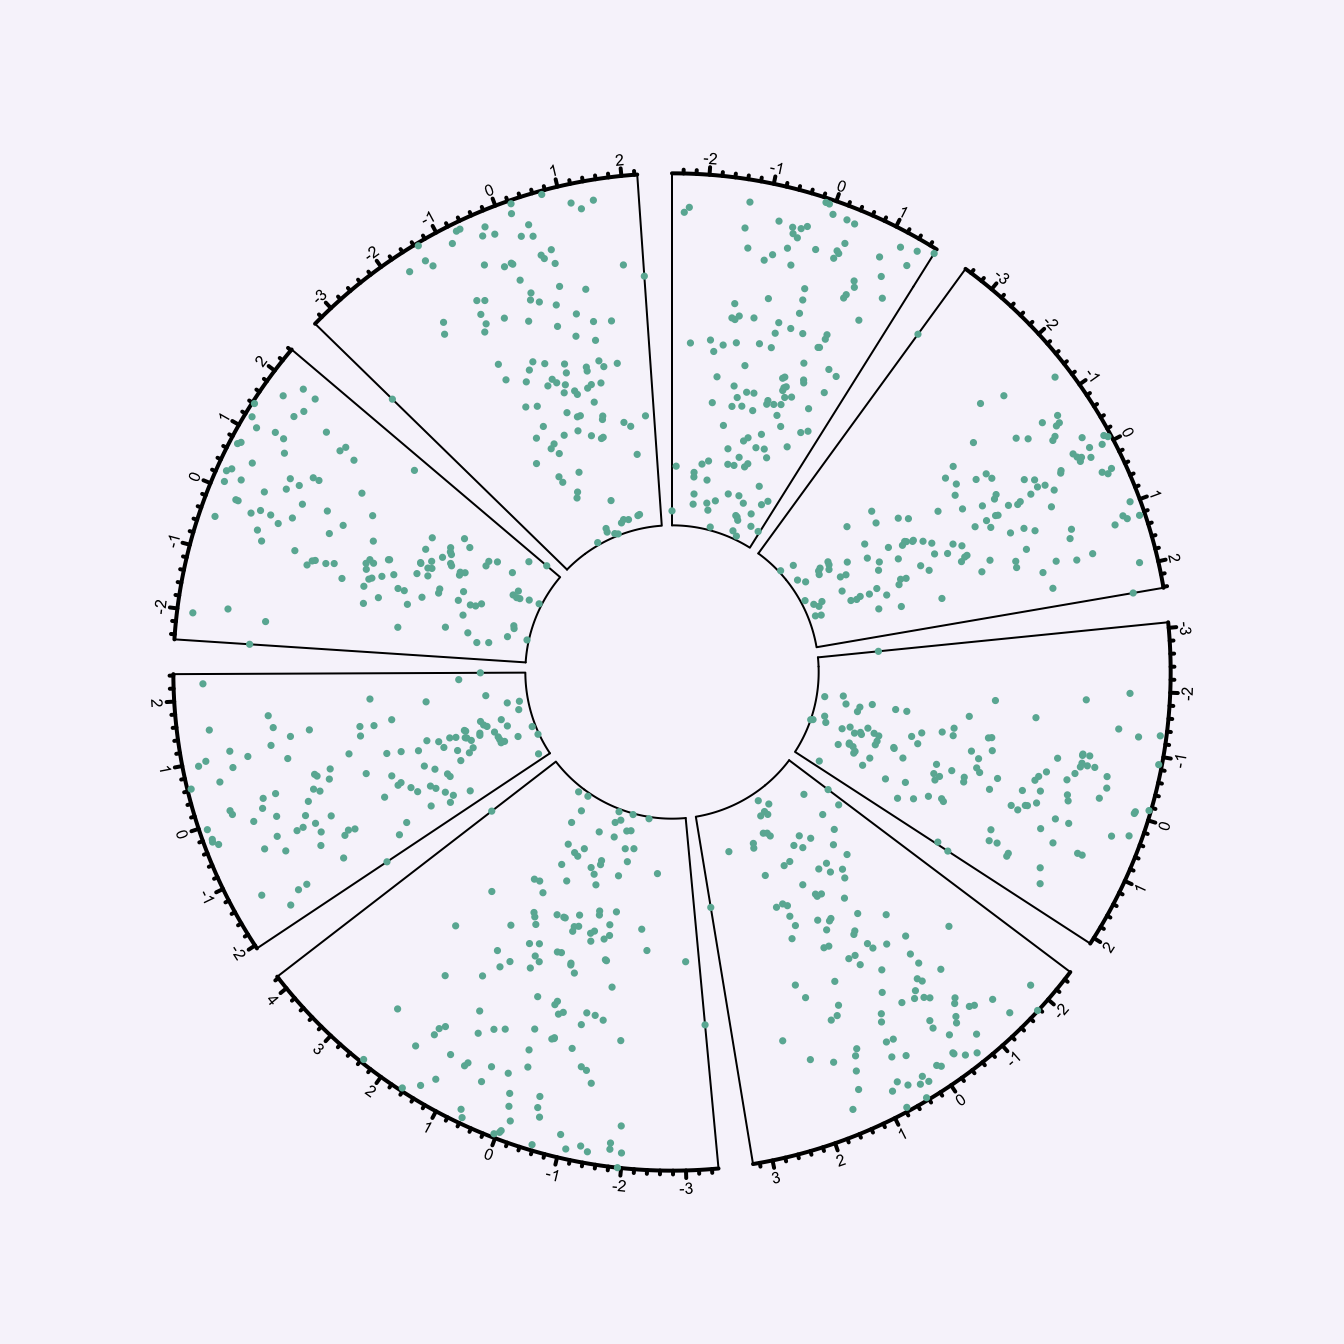
Customization can happen at 3 different levels:
-
initialization: use the usual
par()and the specificcircos.par()functions for general stuff. - in
circos.axis()to customize axis - in circos.trackPoints()` to customize the chart shapes.
Note that most of the parameters are consistent with base R. Have a look to the scatterplot section of the gallery for more customization.
# Upload library
library(circlize)

# Create data
data = data.frame(
    factor = sample(letters[1:8], 1000, replace = TRUE),
    x = rnorm(1000),
    y = runif(1000)
    )

# General Customization:
par(
  mar = c(1, 1, 1, 1),           # Margin around chart
  bg = rgb(0.4,0.1,0.7,0.05)     # background color
)
circos.par("track.height" = 0.6) # track hight, 0.6 = 60% of total height

# Step1: Initialise the chart giving factor and x-axis.
circos.initialize( factors=data$factor, x=data$x )

# Step2: Build regions.
circos.trackPlotRegion(factors = data$factor, y = data$y, panel.fun = function(x, y) {
    circos.axis(
        h="top",                   # x axis on the inner or outer part of the track?
        labels=TRUE,               # show the labels of the axis?
        major.tick=TRUE,           # show ticks?
        labels.cex=0.5,            # labels size (higher=bigger)
        labels.font=1,             # labels font (1, 2, 3 , 4)
        direction="outside",       # ticks point to the outside or inside of the circle ?
        minor.ticks=4,             # Number of minor (=small) ticks
        major.tick.percentage=0.1, # The size of the ticks in percentage of the track height
        lwd=2                      # thickness of ticks and x axis.
        )
    })

# Step 3: Add points
circos.trackPoints(data$factor, data$x, data$y, col = "#69b3a2", pch = 16, cex = 0.5)