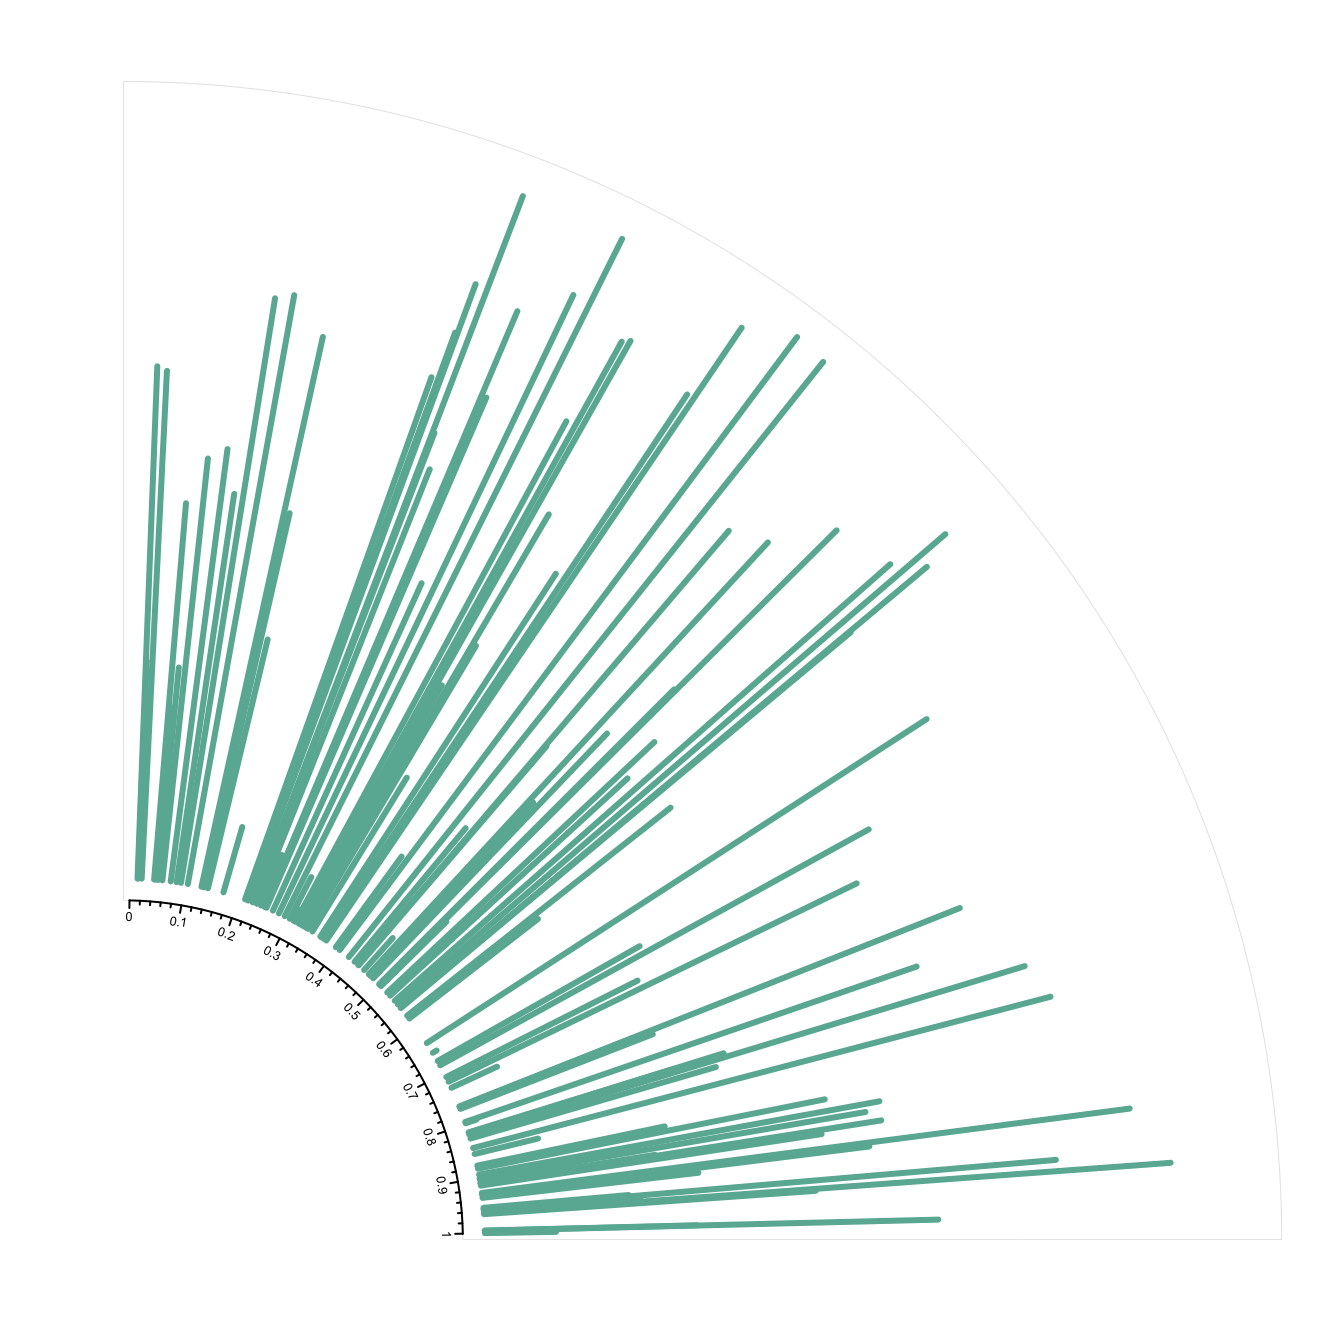
It is possible to draw only a part of a Circular plot. Use
canvas.xlim and canvas.ylim to specify the
zone you want to show, as in the script below.
# library
library(circlize)

# Create data
factors <- letters[1:4]
x1 <- runif(100)
y1 <- runif(100)

# general parameter of the plot.
# With canvas.xlim and canvas.ylim we kind of "zoom on a part of the plot:
par(mar = c(1, 2, 0.1, 0.1) )
circos.par("track.height" = 0.7, "canvas.xlim" = c(0, 1), "canvas.ylim" = c(0, 1), "gap.degree" = 0, "clock.wise" = FALSE)

# Make the usual plot, but with no border
circos.initialize(factors = factors, xlim = c(0, 1))
circos.trackPlotRegion(factors = factors, ylim = c(0, 1), bg.border = NA )

# Finally we plot only the firs sector, so let's change its border to "black" to see it
circos.updatePlotRegion(sector.index = "a", bg.border = "grey" , bg.lwd=0.2)

# Now we can add a plot in this section! You can repeat these steps to add several regions
circos.lines(x1, y1, pch = 16, cex = 0.5, type="h" , col="#69b3a2" , lwd=3)

# Add axis
circos.axis(h="bottom" , labels.cex=0.4, direction = "inside" )

#clear
circos.clear()