Libraries and dataset
We’ll be using the ggplot2 package to create our plots
and draw arrows. Let’s start by loading the necessary libraries and
creating a simple dataset:
Drawing the Simplest Arrow Possible
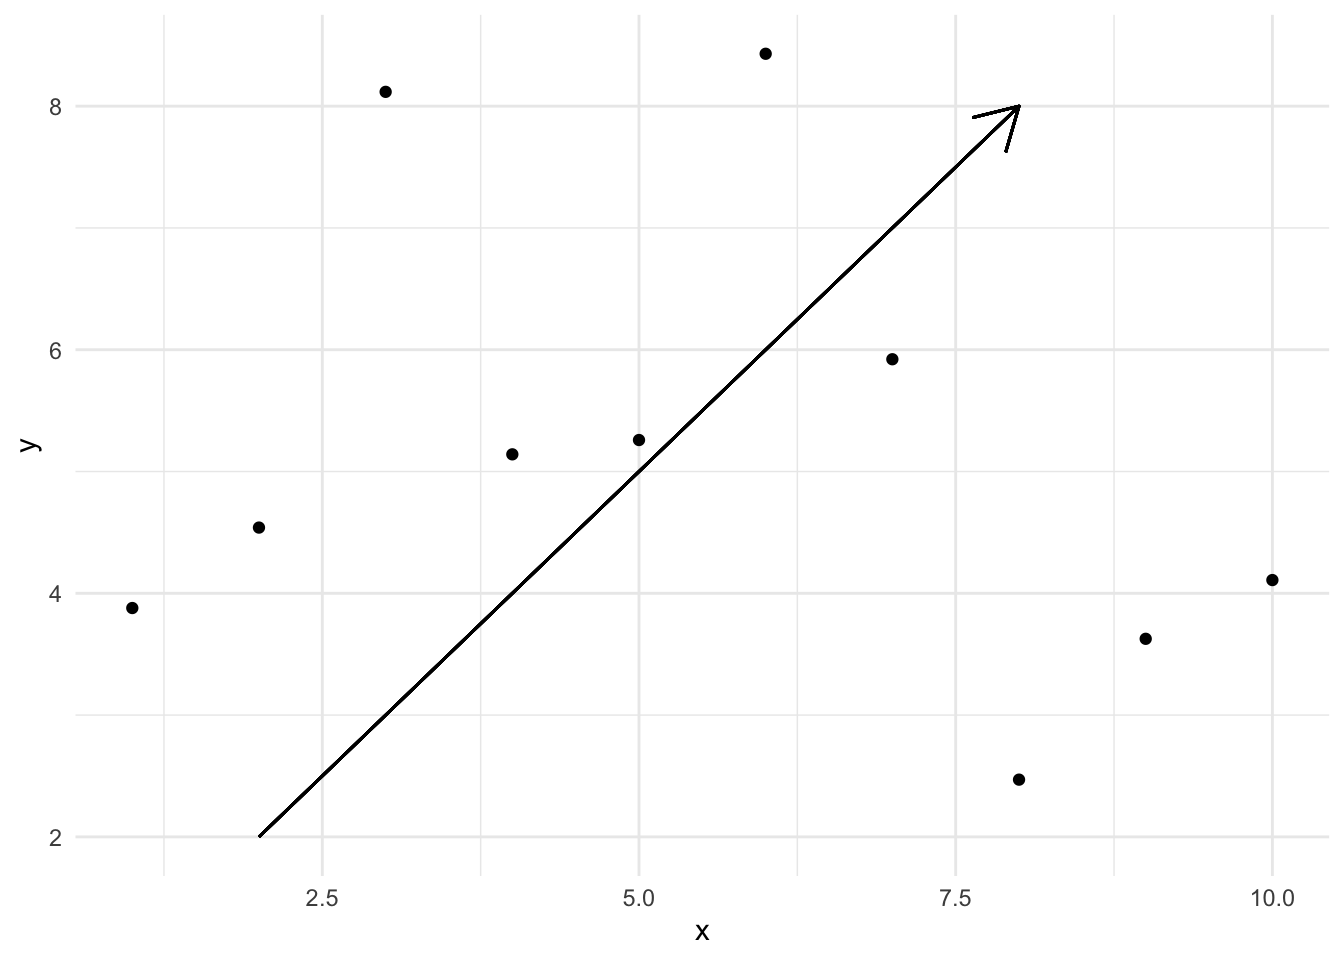
The simplest way to draw an arrow in ggplot2 is by using the
geom_segment() function with the
arrow parameter.
In this code:
-
We start with a basic scatter plot using
geom_point(). - We add
geom_segment()to draw the arrow. -
Inside
geom_segment(), we specify the start (x,y) and end (xend,yend) coordinates of the arrow. -
The
arrow()function is used to add an arrowhead to the end of the segment.
ggplot(df, aes(x, y)) +
  geom_point() +
  geom_segment(aes(x = 2, y = 2, xend = 8, yend = 8),
    arrow = arrow()
  ) +
  theme_minimal()

Customizing Arrow Style
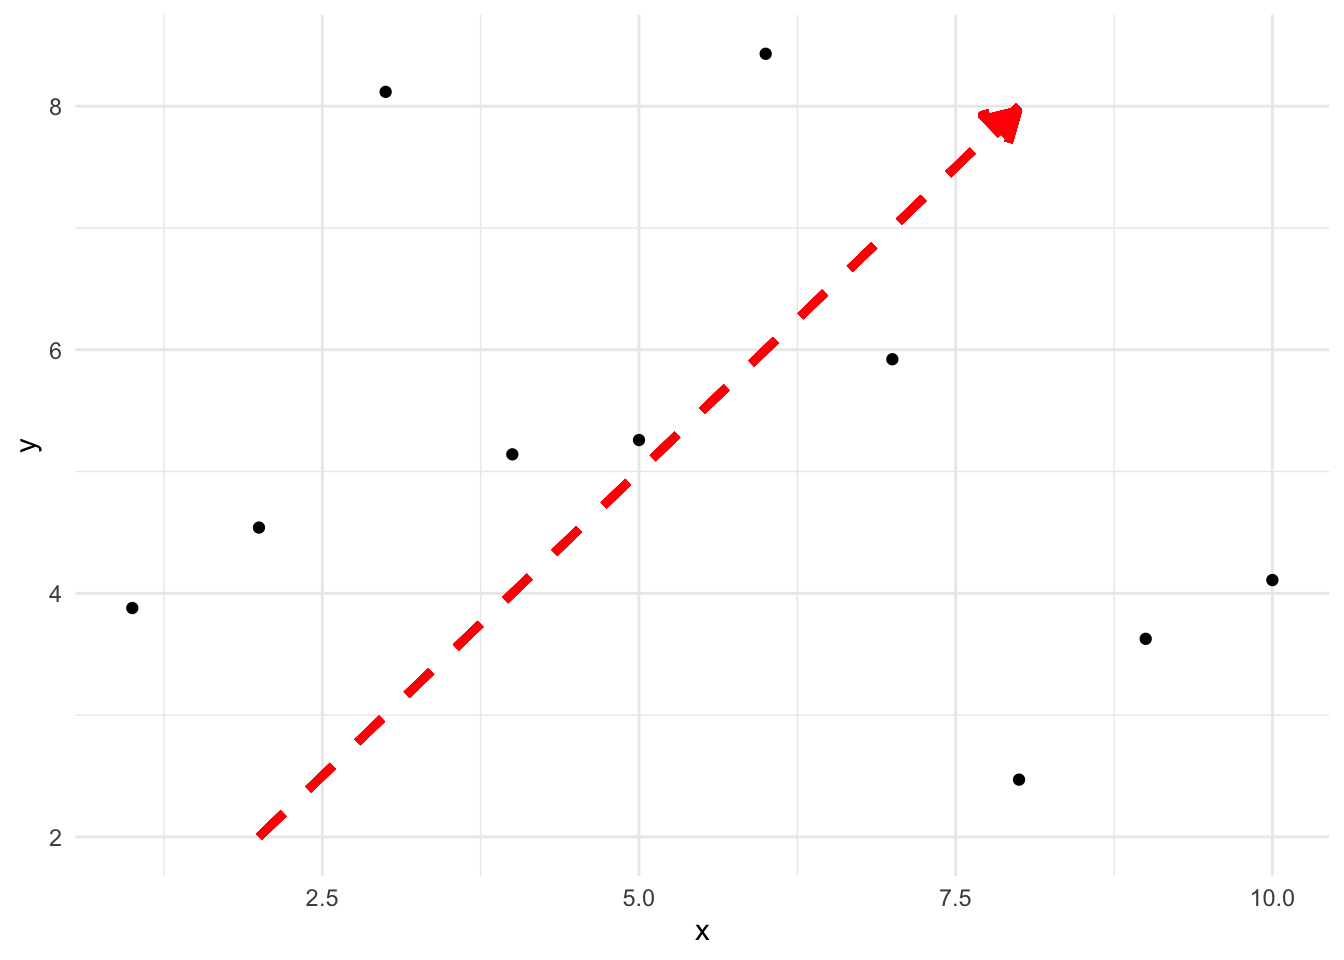
We can customize various aspects of the arrow, such as its color, size, type, and the properties of the arrowhead.
-
We set the
lengthof the arrowhead to 0.5 cm usingunit(0.5, "cm"). -
We change the arrowhead
typeto “closed” for a filled arrowhead. - We set the
colorof the arrow to red. -
We increase the
size(thickness) of the arrow to 1.5. - We change the
linetypeto “dashed”.
ggplot(df, aes(x, y)) +
  geom_point() +
  geom_segment(aes(x = 2, y = 2, xend = 8, yend = 8),
    arrow = arrow(length = unit(0.5, "cm"), type = "closed"),
    color = "red",
    size = 1.5,
    linetype = "dashed"
  ) +
  theme_minimal()

Drawing Curved Arrows
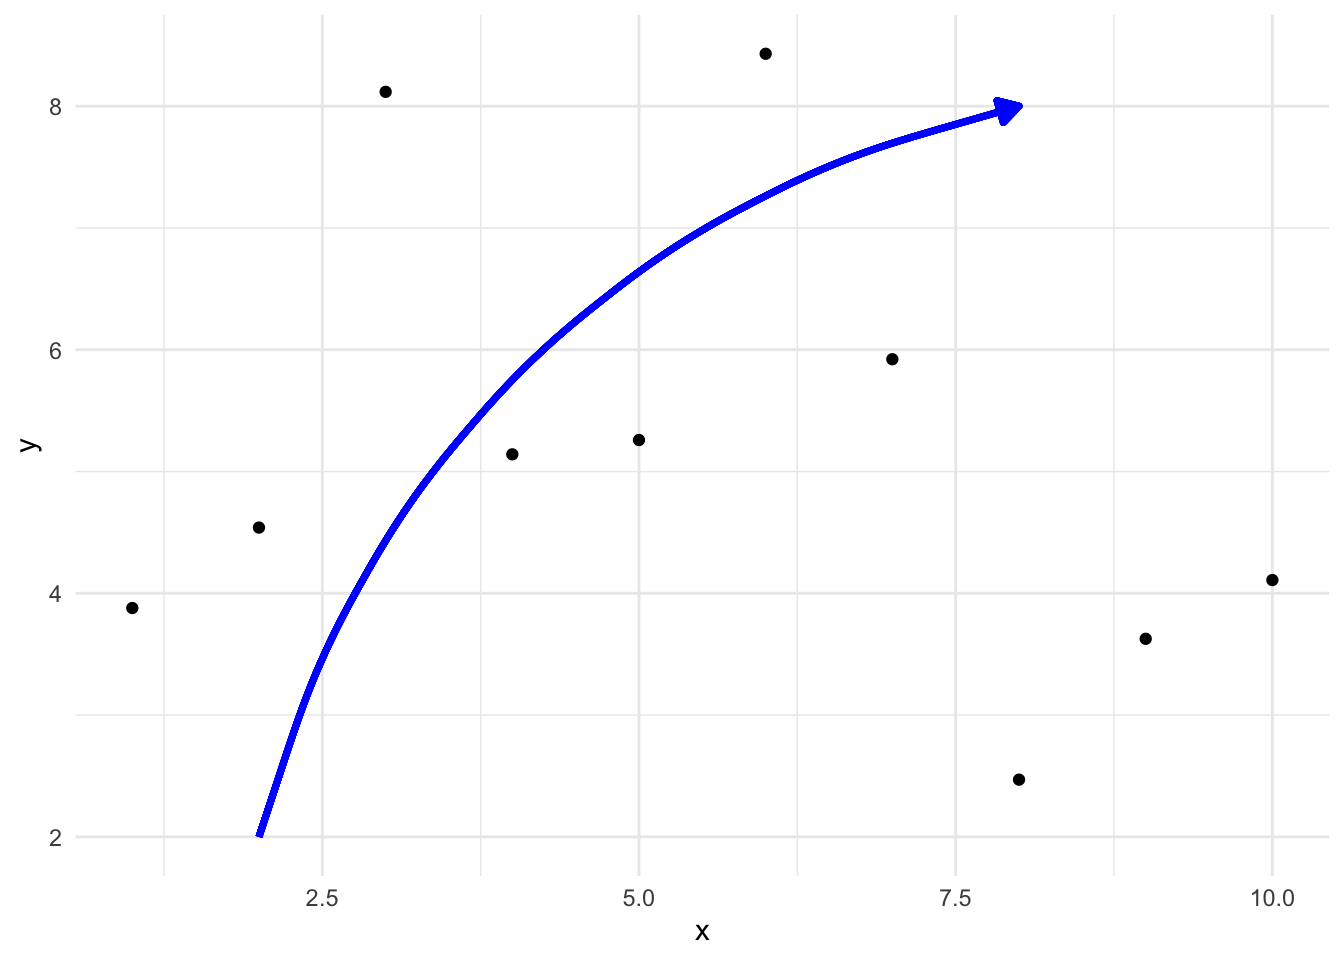
To draw curved arrows, we can use geom_curve() instead of
geom_segment().
-
We replace
geom_segment()withgeom_curve(). -
We add a
curvatureparameter to control the bend of the arrow. Negative values curve the arrow clockwise, while positive values curve it counterclockwise. -
We adjust the
lengthof the arrowhead to 0.3 cm for better proportions with the curve. -
We set the arrow
colorto blue and itssizeto 1.2.
ggplot(df, aes(x, y)) +
  geom_point() +
  geom_curve(aes(x = 2, y = 2, xend = 8, yend = 8),
    arrow = arrow(length = unit(0.3, "cm"), type = "closed"),
    color = "blue",
    size = 1.2,
    curvature = -0.3
  ) +
  theme_minimal()

Going further
You might be interested in:
- How annotations work in ggplot
- Learning how to annotate a specific element in a single plot
- Exploring more ggplot2 geoms for different types of visualizations


