Cheatsheet


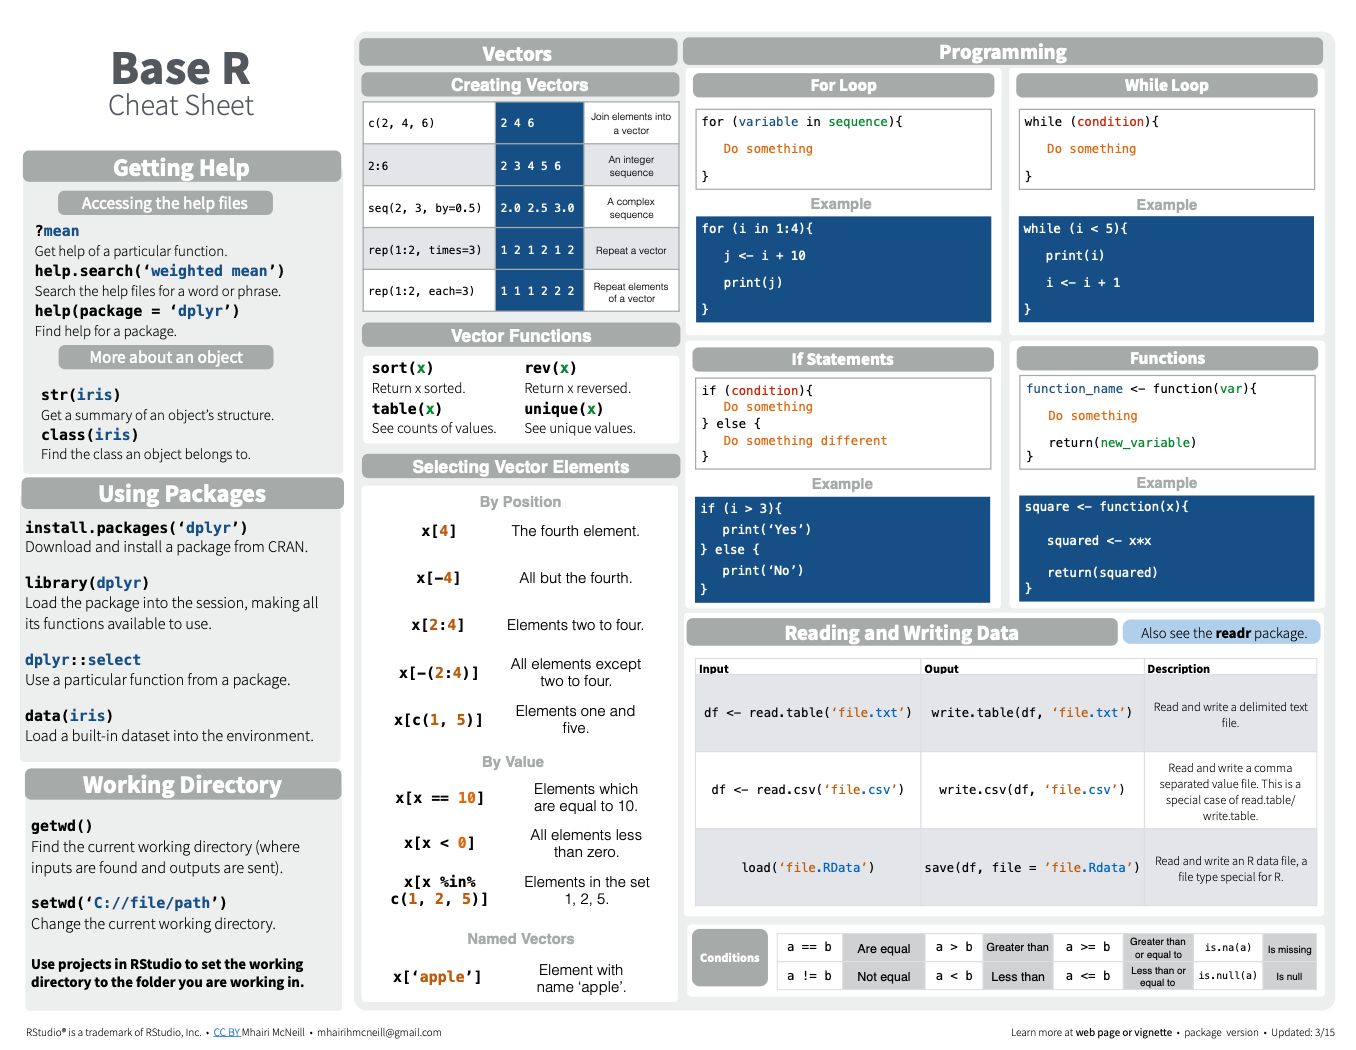
This section offers a collection of cheatsheets on R and data visualization, covering ggplot2, dplyr, colors, shapes, animation, and more. The best way to access them is to get them delivered straight to your inbox:

Tidyverse

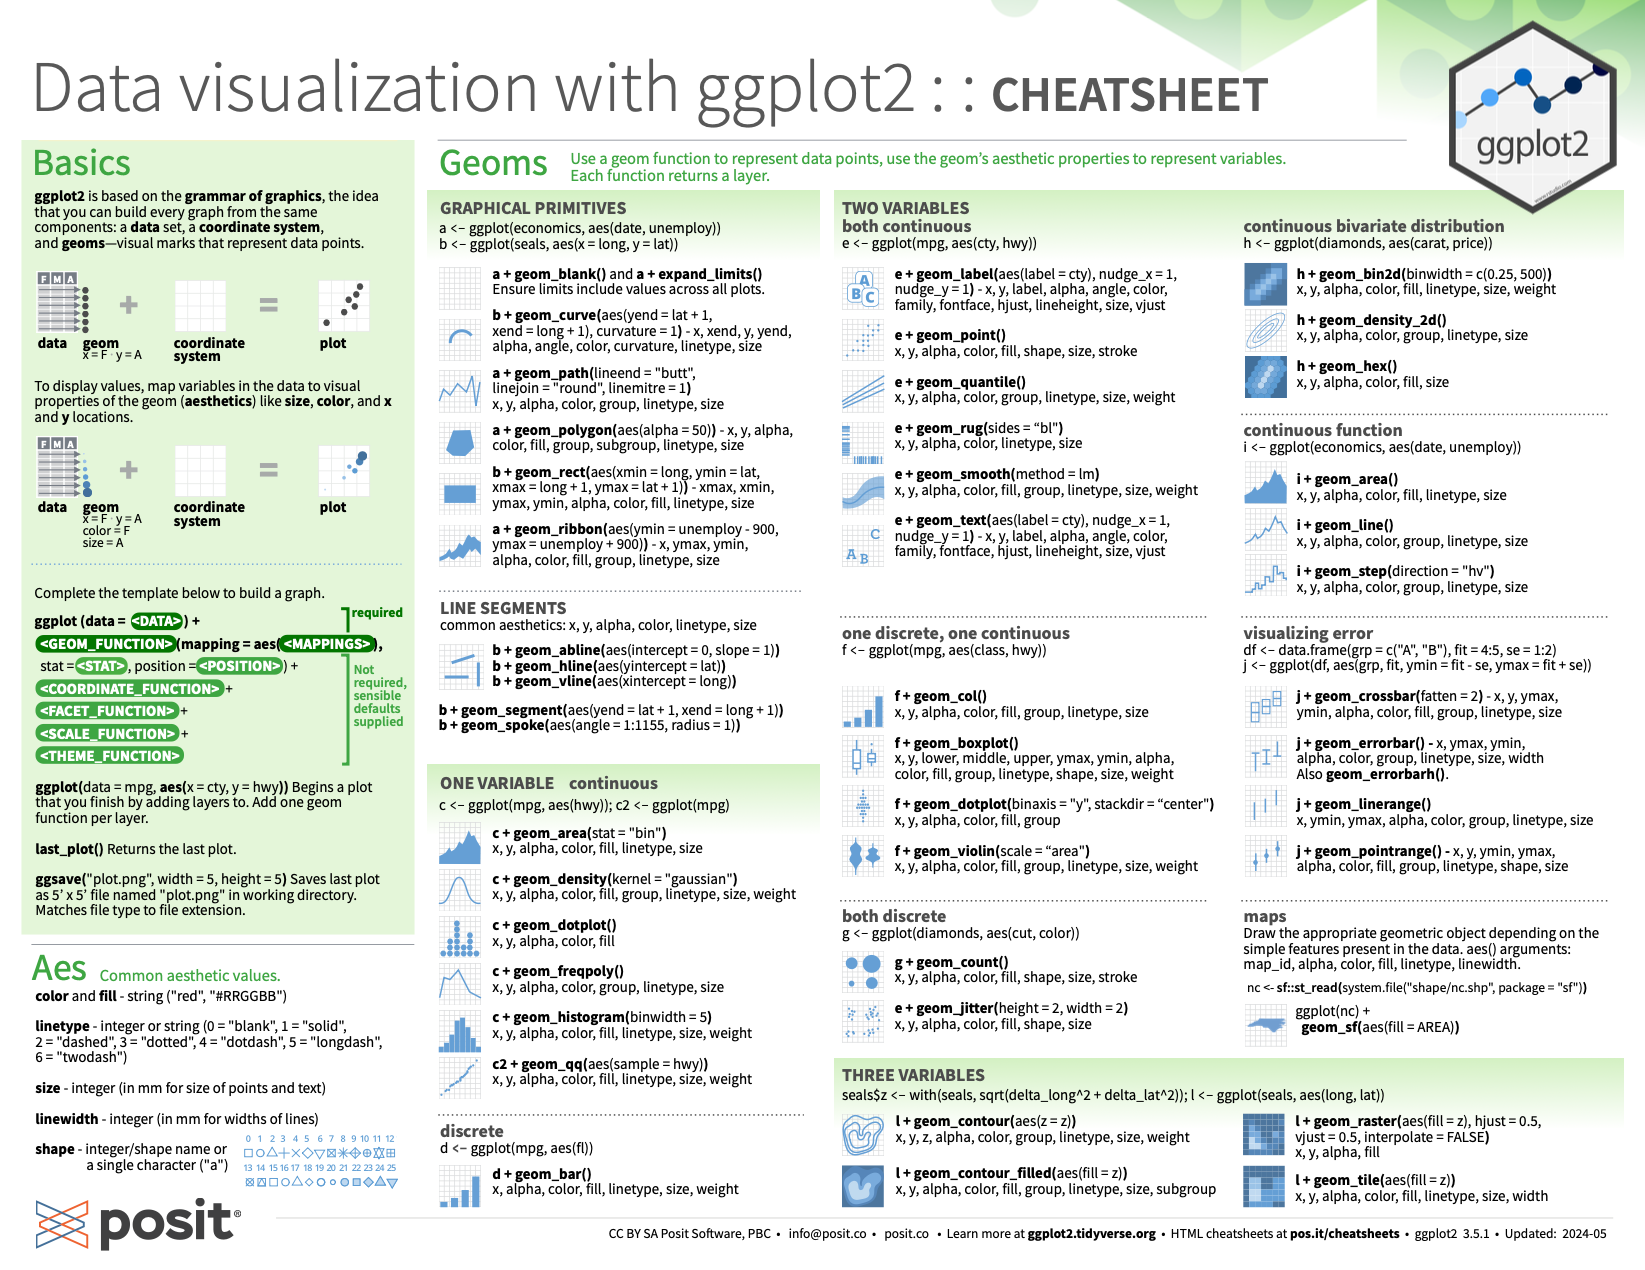
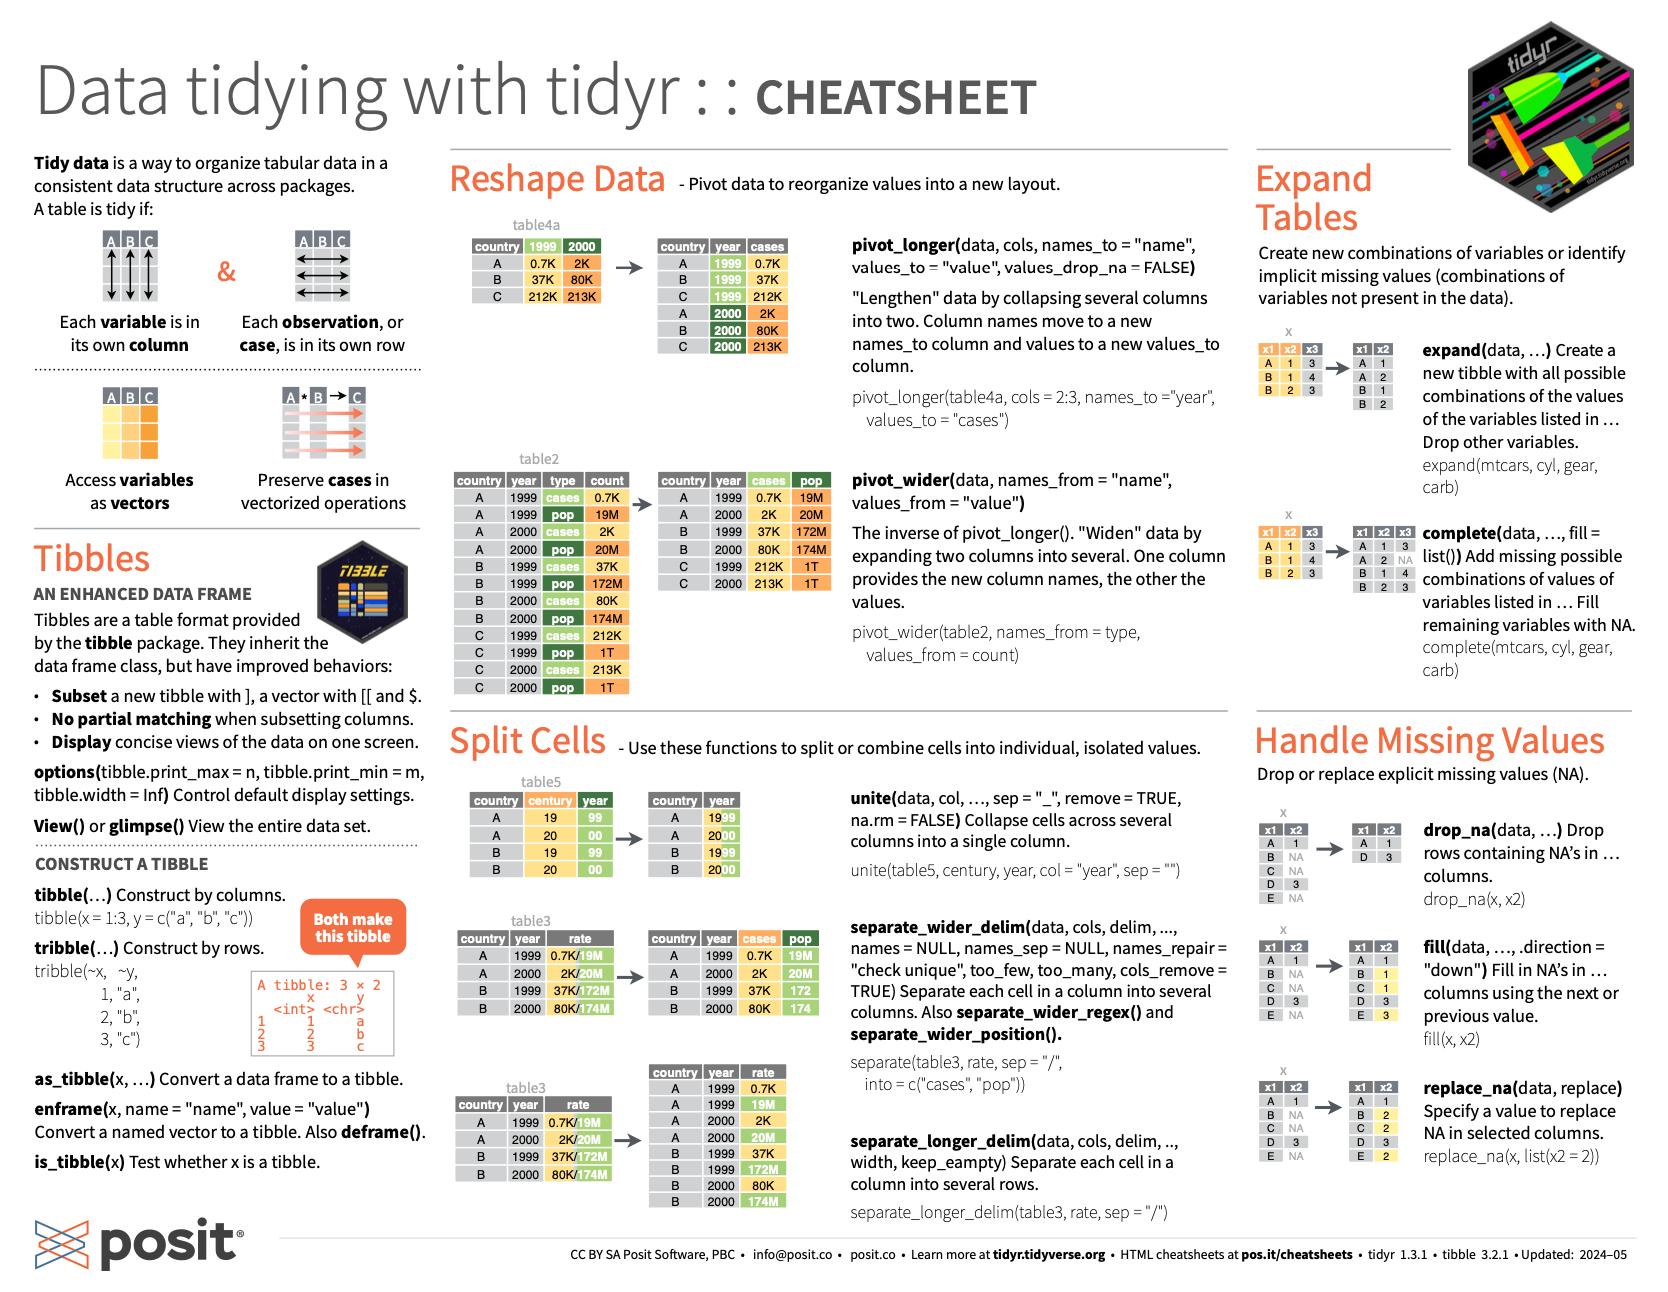
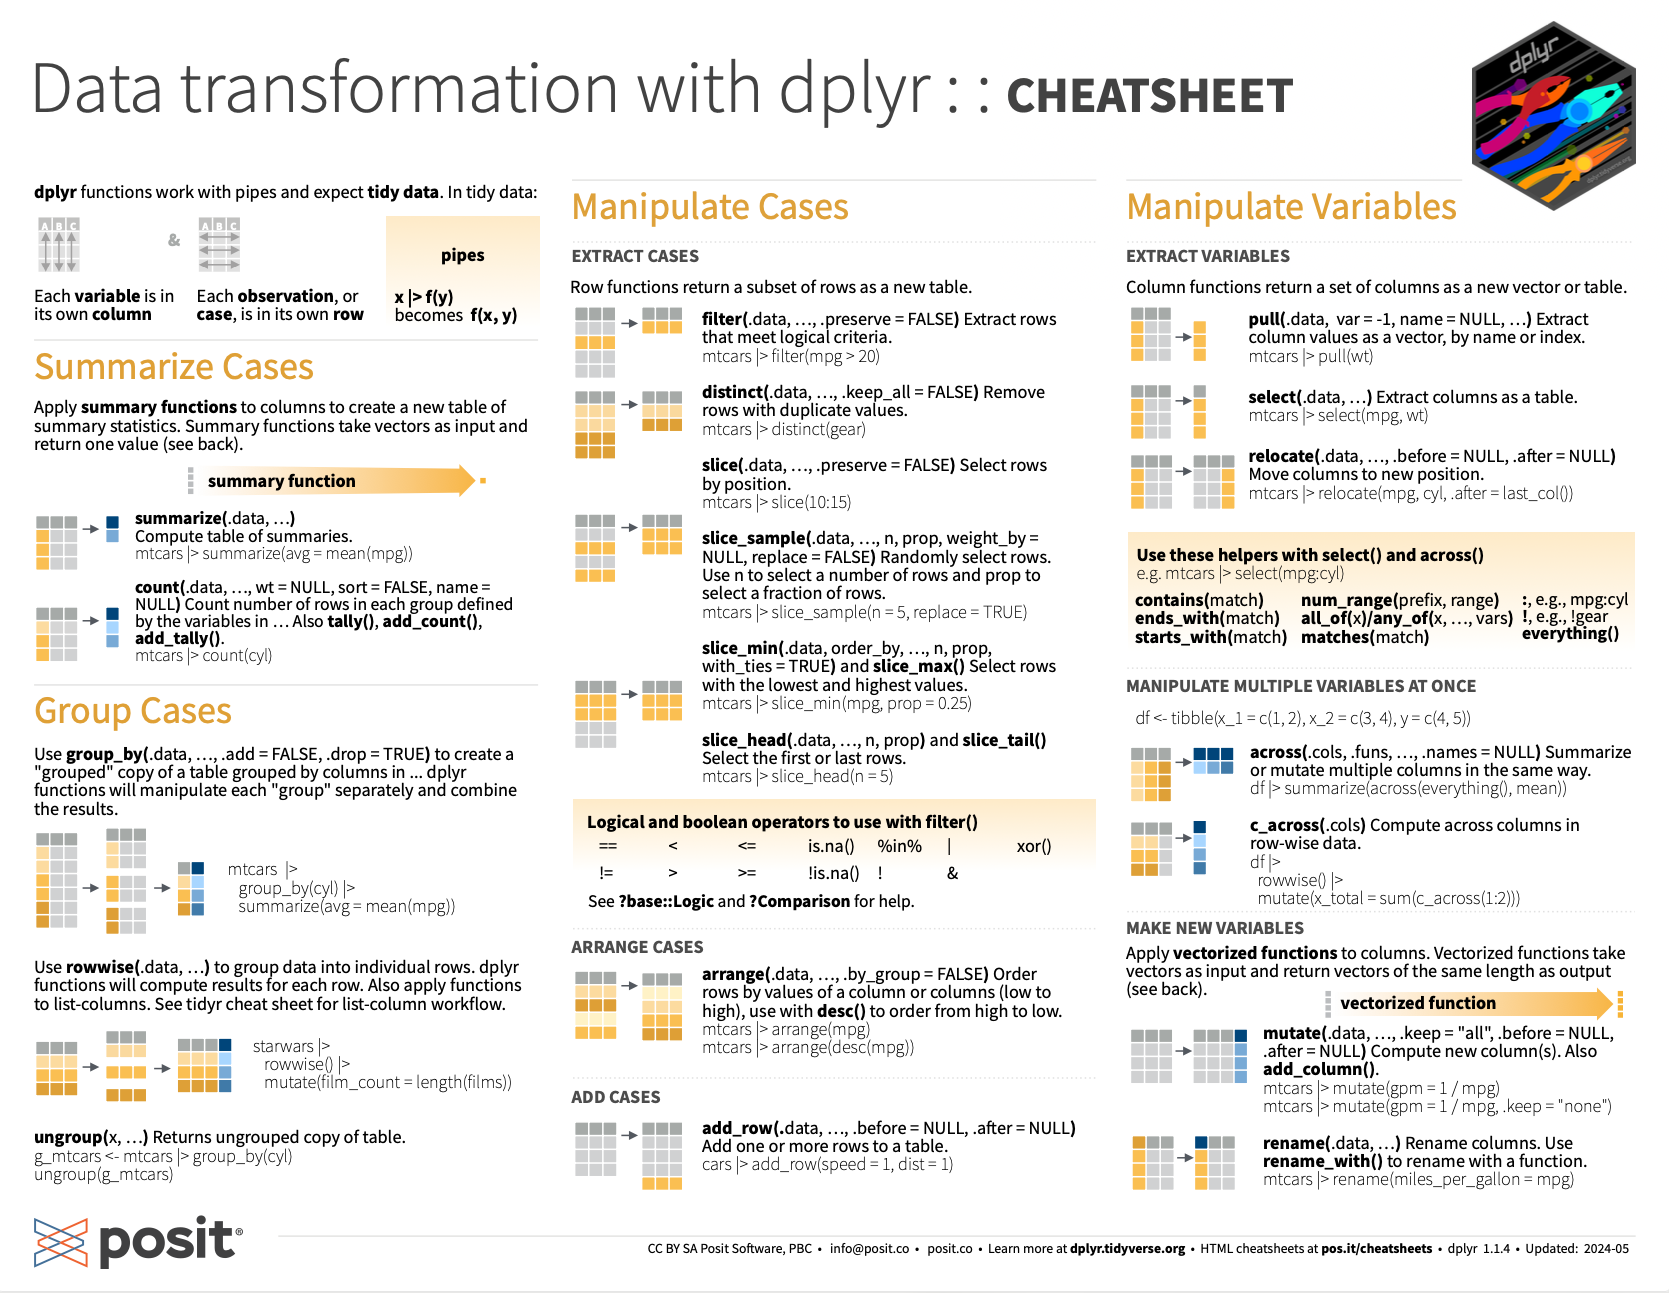
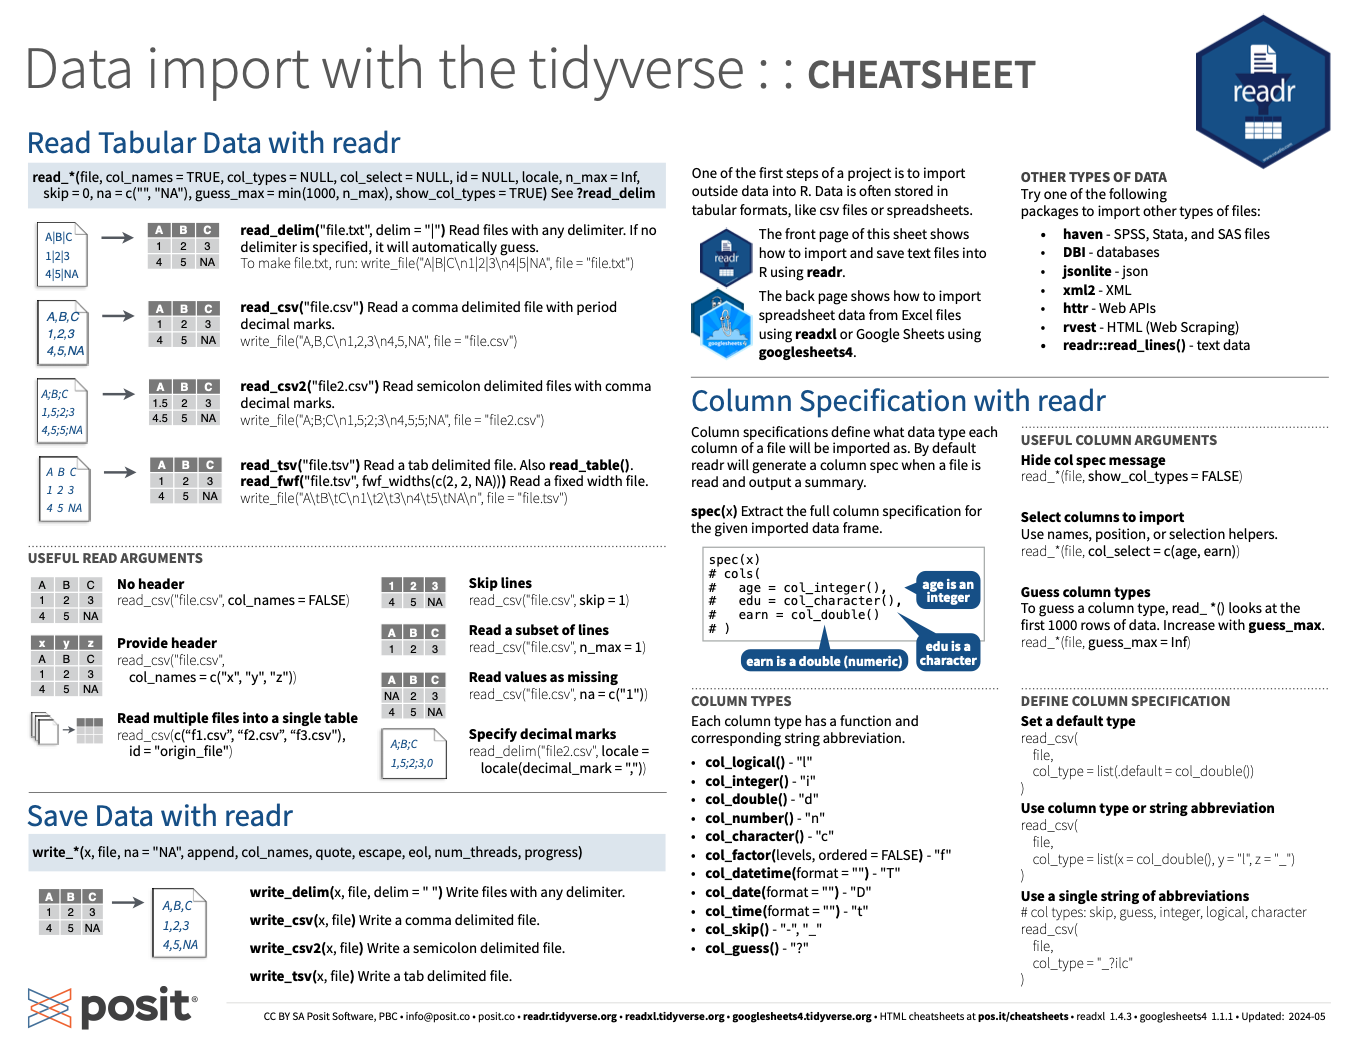
Four cheatsheets provided by Posit about the tidyverse. You can find some more on their official website (link).

Data Visualization

Not sure which chart type is best for your data?

The Data To Viz project is a decision tree that guides you to the right choice. Simply describe your data format, and it will suggest the most suitable chart types.

The poster below visualizes the entire decision tree.

Picking one color with R


There are 5 main methods to call a color in R. Click the buttons below to see a description of them

Name rgb() Number Hex code

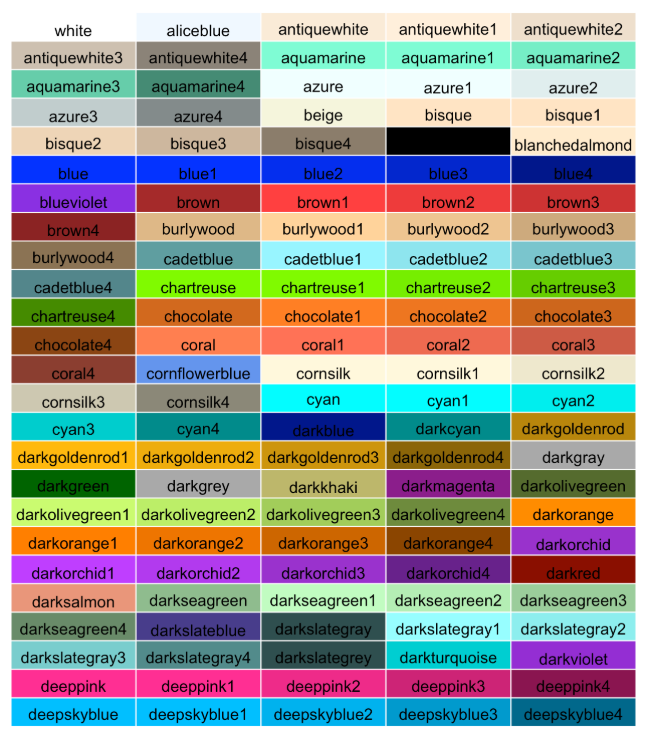
Name → The most common method is to call a color by its name. R offers about 657 color names. You can read all of them using colors().

Read more
ggplot2 theme
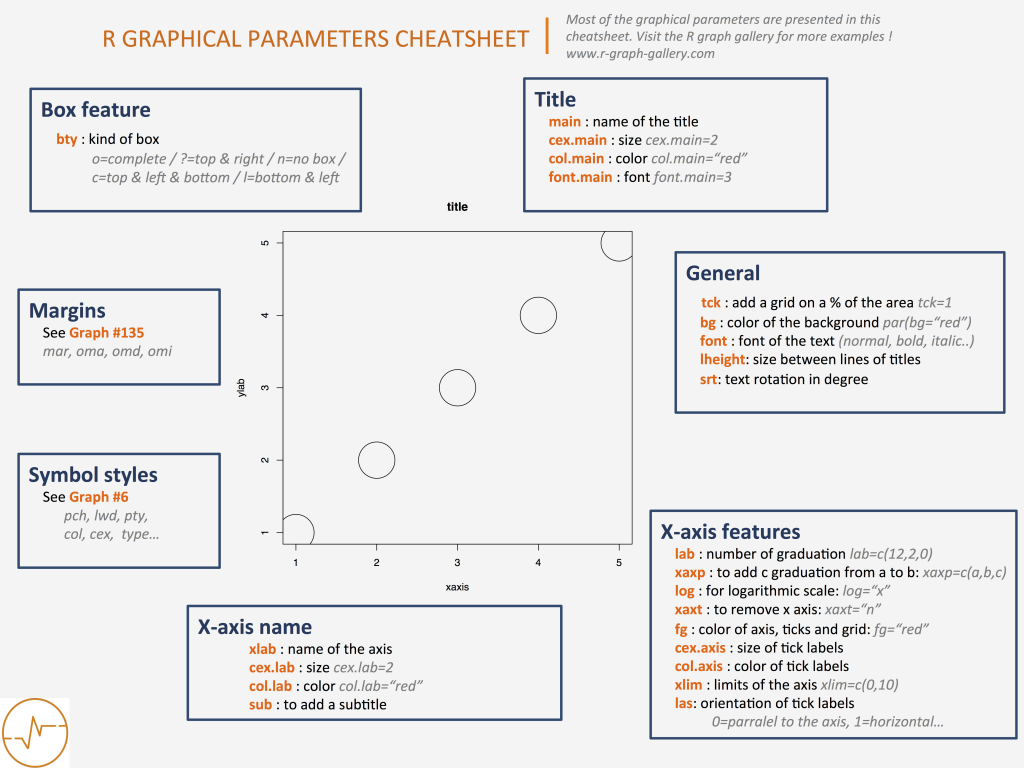
Base R

Related chart types


Scatter
Heatmap
Correlogram
Bubble
Connected scatter
Density 2d