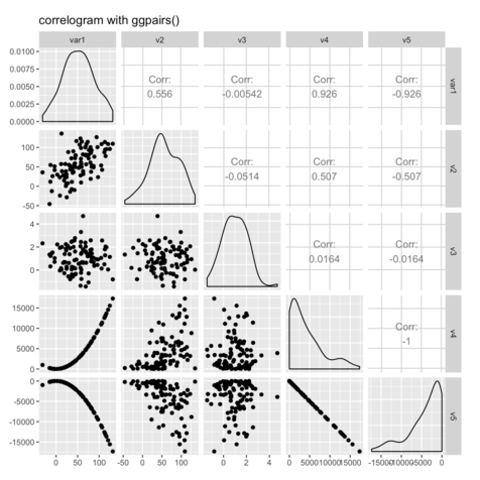
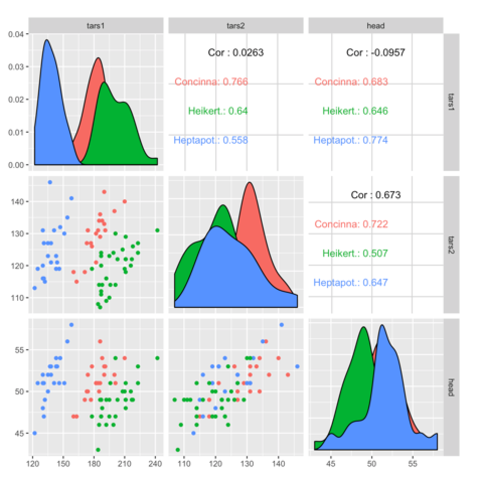
Using the
GGally package
The GGally package offers great options to build
correlograms. The ggpairs() function build a
classic correlogram
with scatterplot, correlation coefficient and variable distribution.
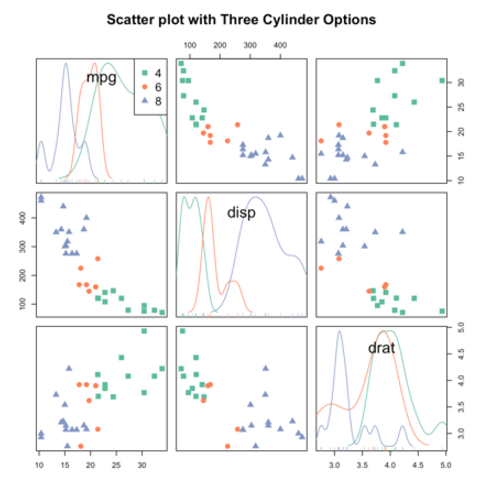
On top of that, it is possible to inject
ggplot2 code, for instance to
color categories.
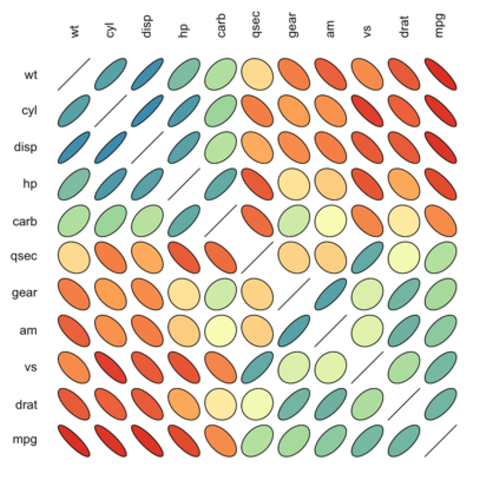
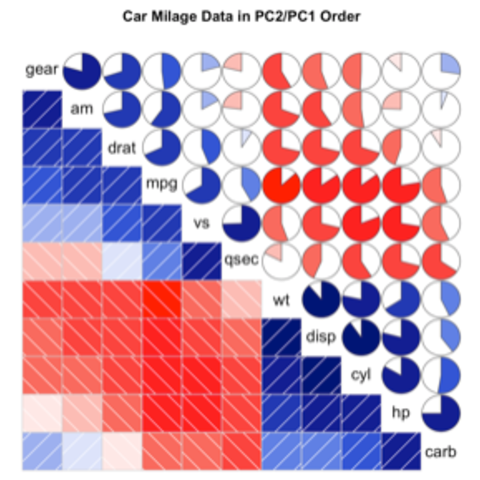
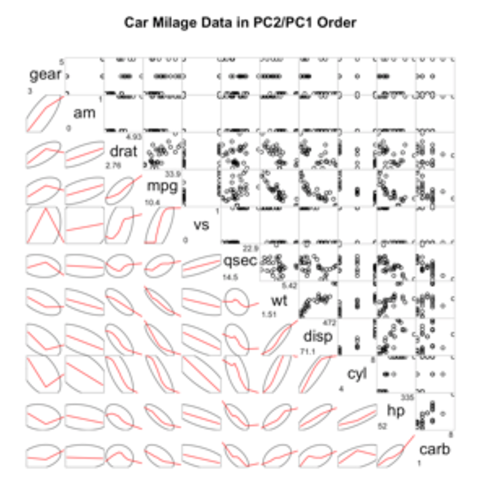
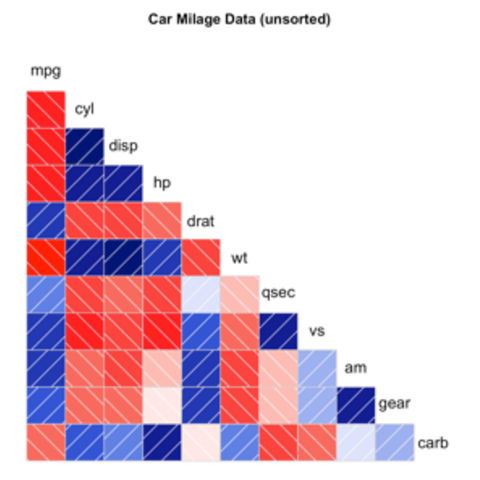
Using the
corrgram package
The corrgram is another great alternative to build
correlograms. You can choose what to display in the upper, lower and diagonal
part of the figure: scatterplot, pie chart, text, ellipse and more.
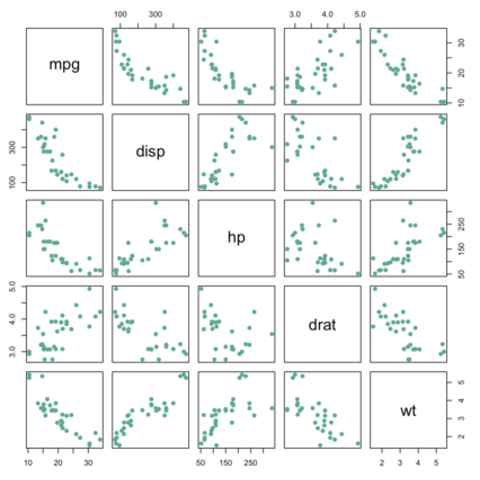
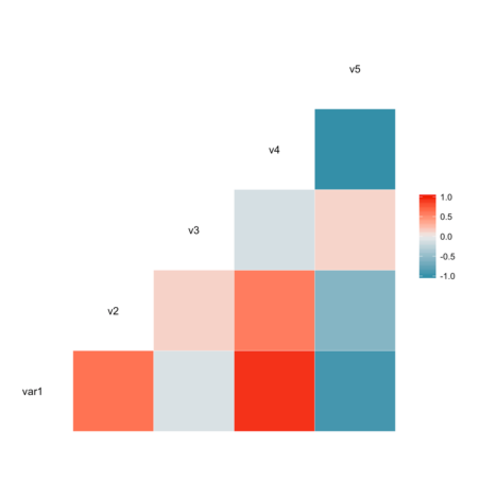
Other methods
Lesser known ways to build correlogram with R, like the
ellipse package, the plot() function and the
car package.