This is my cheatsheet to remember the base R plot parameters. Everything that concerns the X axis also works for the Y axis of course. The R graph gallery offers 2 other cheatsheets: one concerning symbol styles and another concerning margins.
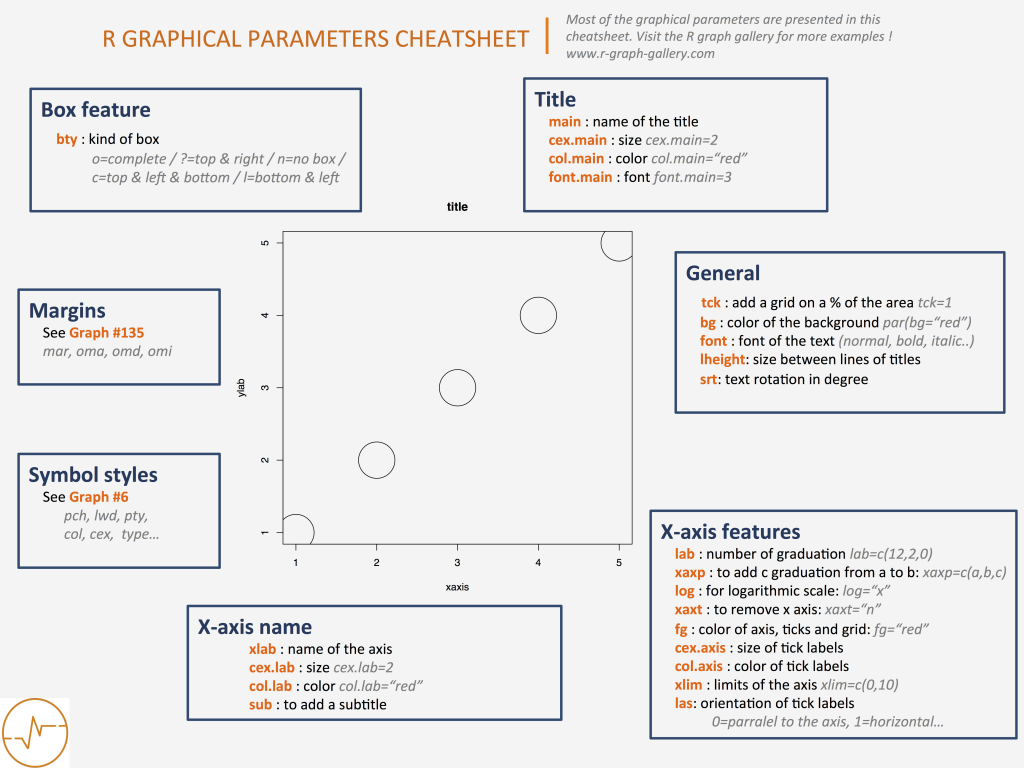
A cheatsheet to quickly remember how to customize title, axis, margin, symbols on base R Charts.
This is my cheatsheet to remember the base R plot parameters. Everything that concerns the X axis also works for the Y axis of course. The R graph gallery offers 2 other cheatsheets: one concerning symbol styles and another concerning margins.
Related chart types