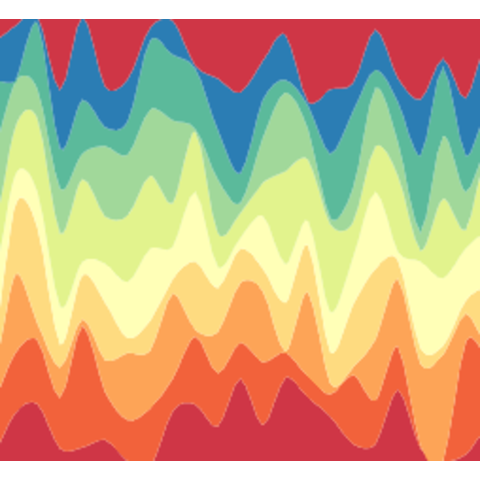
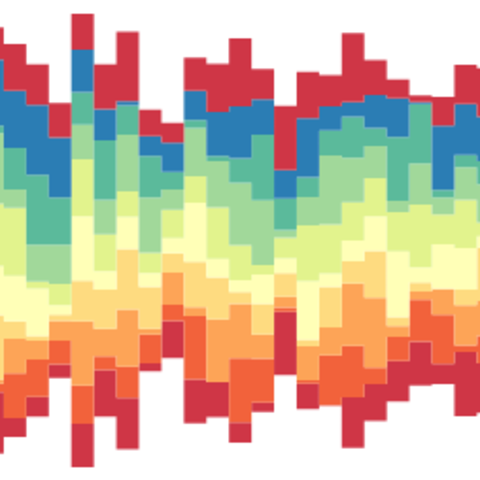
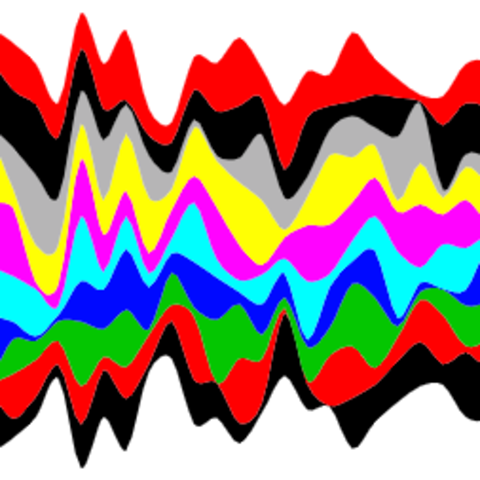
A streamgraph is a type of stacked area chart. It represents the evolution of a numeric variable for several groups. Areas are usually displayed around a central axis, and edges are rounded to give a flowing shape.
streamgraph package.
It is relatively straightforward to build a streamgraph in R thanks to
the streamgraph package.
The streamgraph package is a html widget. It means that
your output will automatically be interactive. Hover a group to
highlight it, get its name and its exact value. If for some reason you
need to export it to png or pdf, it is
possible thanks to the
webshot
package.
The web is full of astonishing R charts made by awesome bloggers. The R graph gallery tries to display some of the best creations and explain how their source code works. If you want to display your work here, please drop me a word or even better, submit a Pull Request!