This section is tightly linked with other sections. A line chart is the same but doesn't fill the surface between the line and the X axis. A connected scatterplot is almost the same thing, but each observation is represented as a dot. More generally, the time series section can interest you.
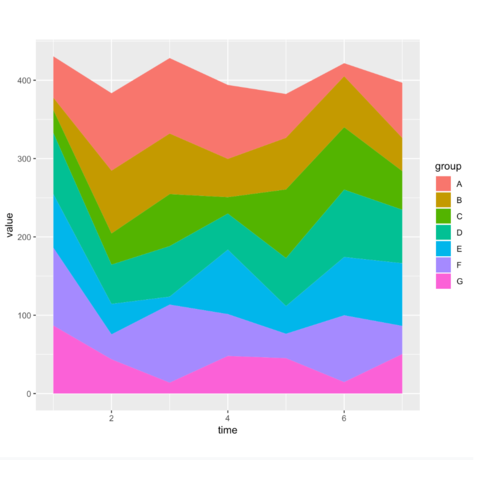
connected scatter line chart time seriesggplot2Drawing a stacked area chart with ggplot2 is pretty straightforward once you've understood how to build an area chart with geom_area(). Basically, you just have to provide a categorical to the fill argument to split the area by groups.
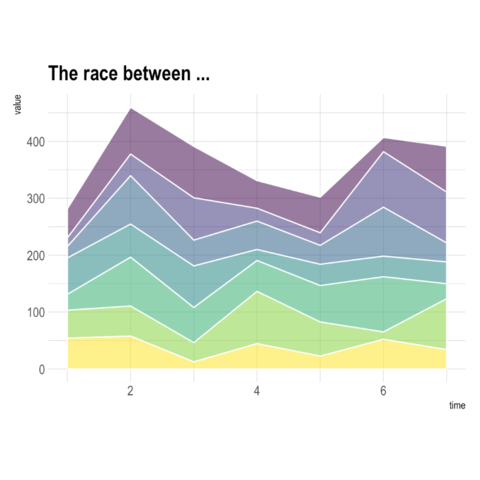
plotlyThe ggplotly() function of the plotly library makes it a breeze to build an interactive version. Try to hover circles to get a tooltip, or select an area of interest for zooming. Double click to reinitialize.
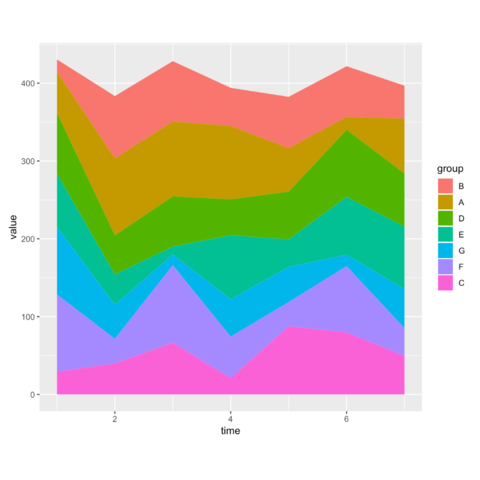
Stacking suffers several issues. In the left chart below, try to estimate how the green group evolved during the period? You can read more about this caveat here. Depending what your final goal is, it can be better to use small multiple or unstacked line chart.
Learn more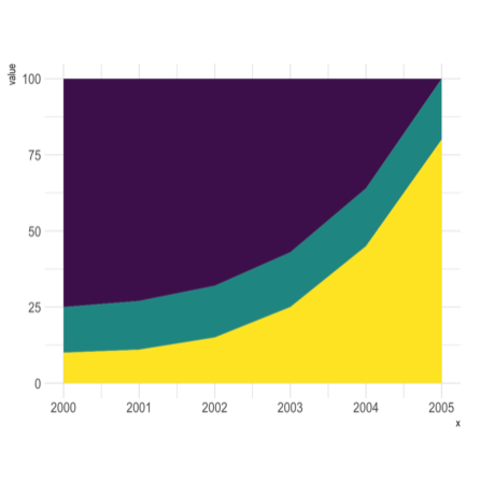
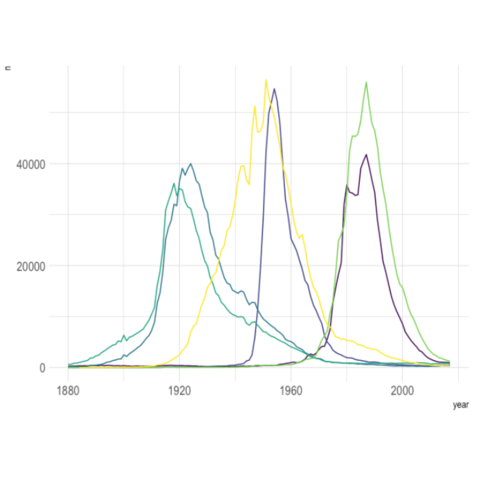

dygraphThe dygraph package is dedicated to time series visualization. It offers zooming, hovering, minimaps and much more. Visit the time series section that is dedicated to it for more.
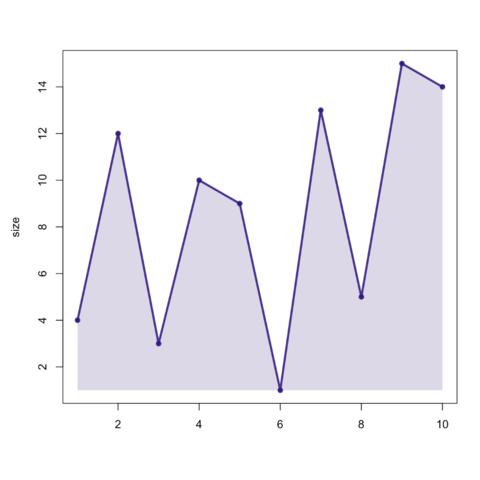
In base R, the combination of the plot() and the polygon() functions allows to build quality stacked area charts.
The web is full of astonishing R charts made by awesome bloggers. The R graph gallery tries to display some of the best creations and explain how their source code works. If you want to display your work here, please drop me a word or even better, submit a Pull Request!

Line chart with labels
It is a common need to display labels at the end of the lines, since that's the place where labels are the more readable. Cédric Scherer gives us a nice walk-through here on how to do it with ggplot2.

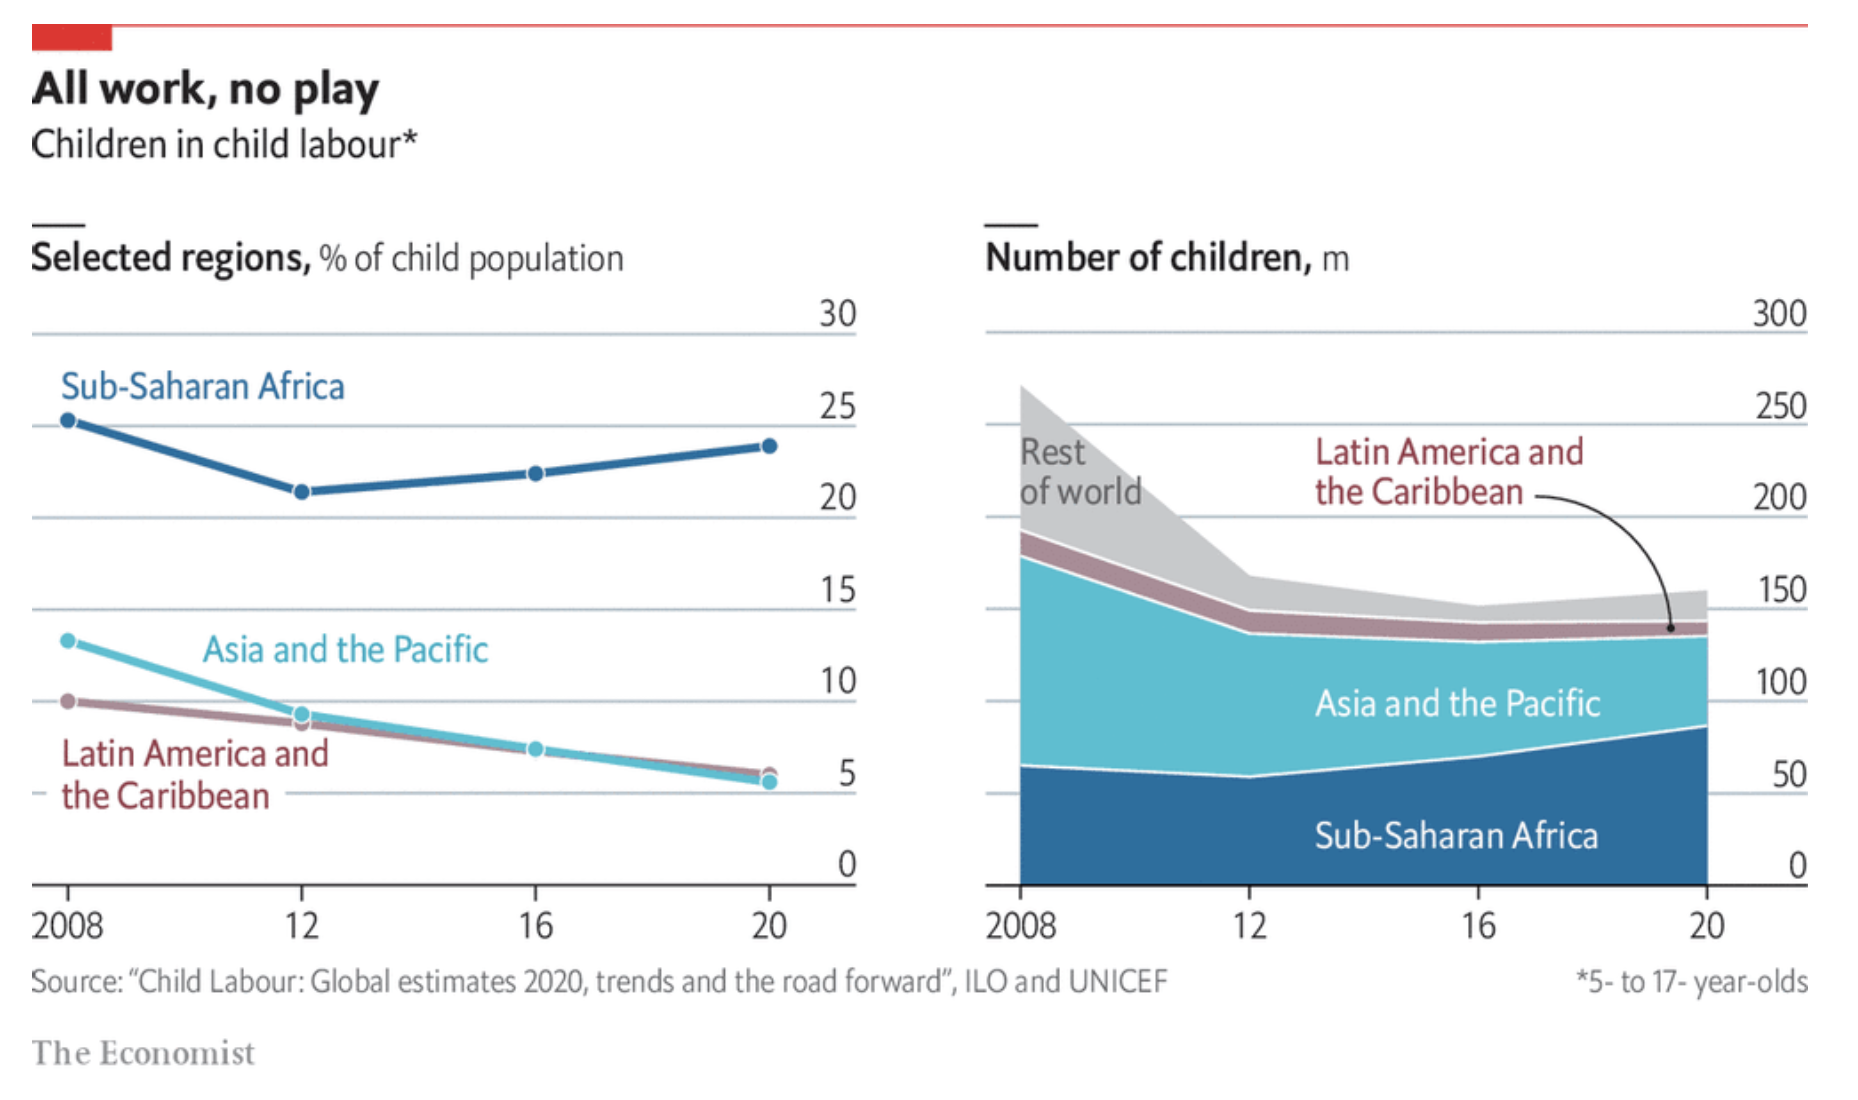
Line and Area charts by The Economist
Learn how to mimick the style of The Economist with libraries like ggplot2, patchwork, grid, ggtext and more.
Related chart types