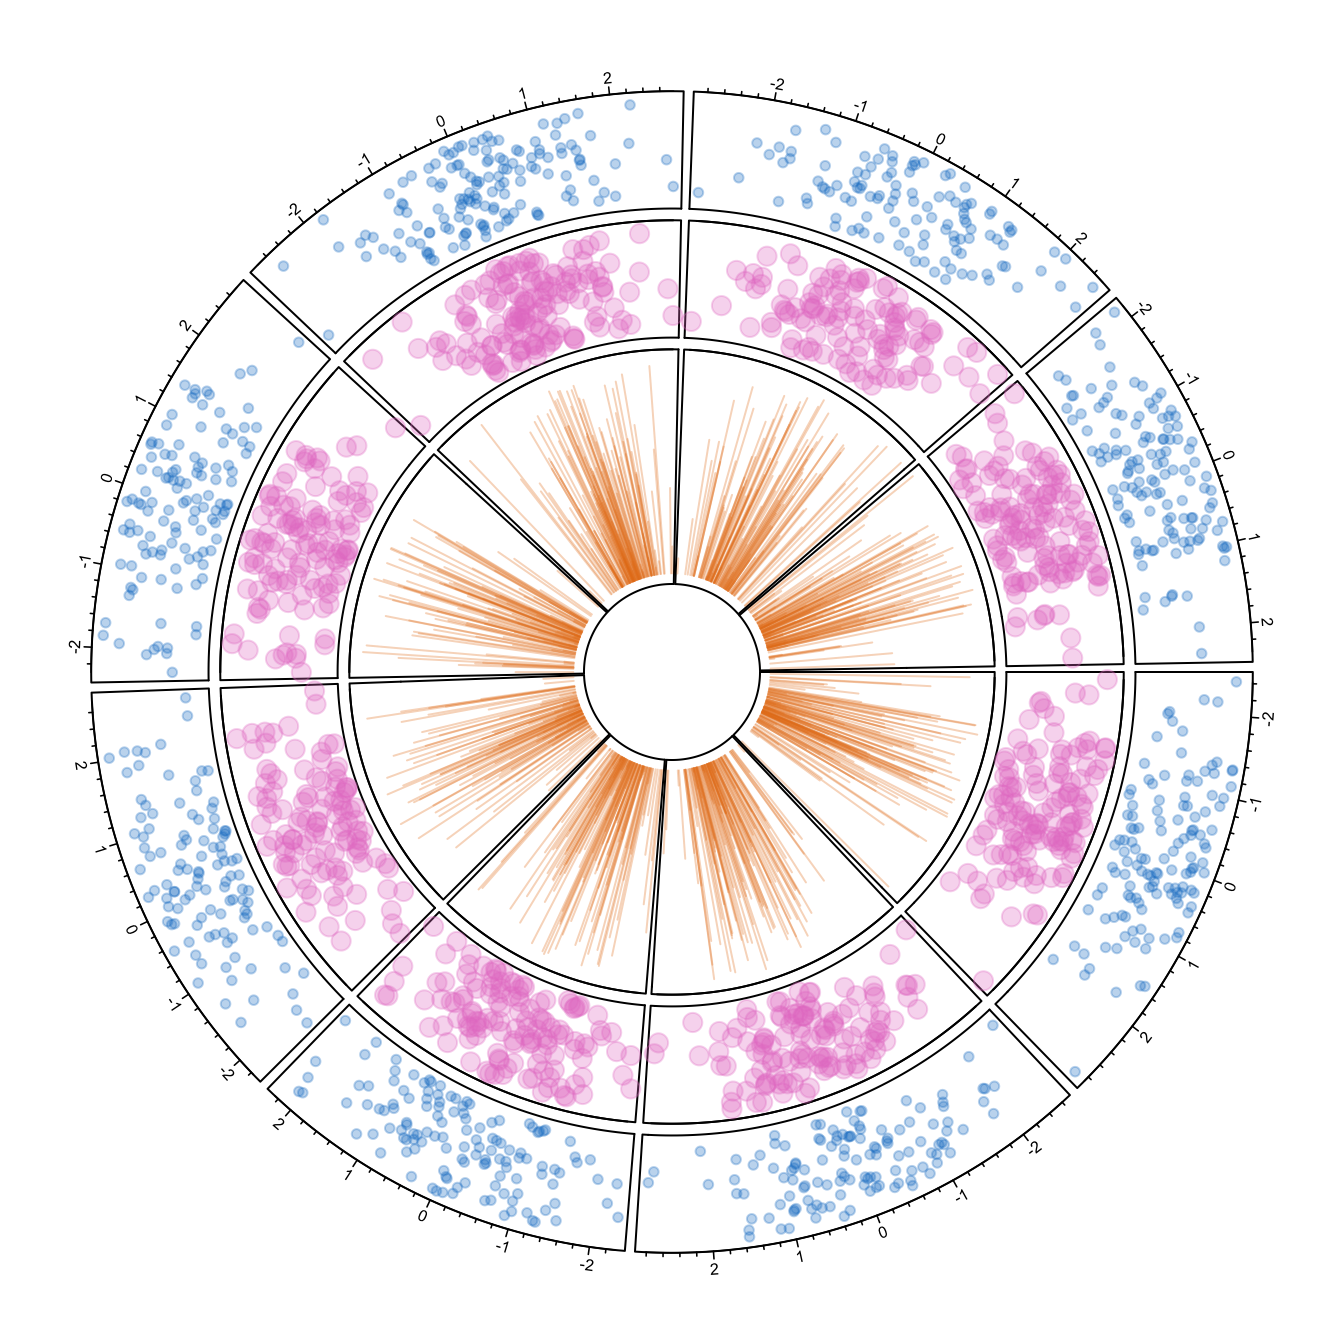
If you read the graph #224, and #225 you know how to make circular plots and customize them.
It is possible to add several tracks on your circular plot: just
repeat the step 2 (building regions with
circos.trackPlotRegion) and 3 (adding dots with
circos.trackPoints for instance).
Note that you can custom the width of each track using
track.height.
#library
library(circlize)
circos.clear()

#Create data
data = data.frame(
    factor = sample(letters[1:8], 1000, replace = TRUE),
    x = rnorm(1000),
    y = runif(1000)
    )

#Initialize the plot.
par(mar = c(1, 1, 1, 1) )
circos.initialize(factors = data$factor, x = data$x )


# Build the regions of track #1
circos.trackPlotRegion(factors = data$factor, y=data$y, panel.fun = function(x, y) {
    circos.axis(labels.cex=0.5, labels.font=1, lwd=0.8)
    })
# --> Add a scatterplot on it:
circos.trackPoints(data$factor, data$x, data$y, col = rgb(0.1,0.5,0.8,0.3), pch=20)


# Build the regions of track #2:
circlize::circos.trackPlotRegion(factors = data$factor, y=data$y, panel.fun = function(x, y) {
    circos.axis(labels=FALSE, major.tick=FALSE)
    })
# --> Add a scatterplot on it
circos.trackPoints(data$factor, data$x, data$y, col = rgb(0.9,0.5,0.8,0.3), pch=20, cex=2)


# Add track #3 --> don't forget you can custom the height of tracks!
circos.par("track.height" = 0.4)
circos.trackPlotRegion(factors = data$factor, y=data$y, panel.fun = function(x, y) {
    circos.axis(labels=FALSE, major.tick=FALSE)
    })
circos.trackLines(data$factor, data$x, data$y, col = rgb(0.9,0.5,0.1,0.3), pch=20, cex=2, type="h")
# and continue as long as needed!