Chart #224, and
#225 introduced
the circlize package and its ability to build circular
charts.
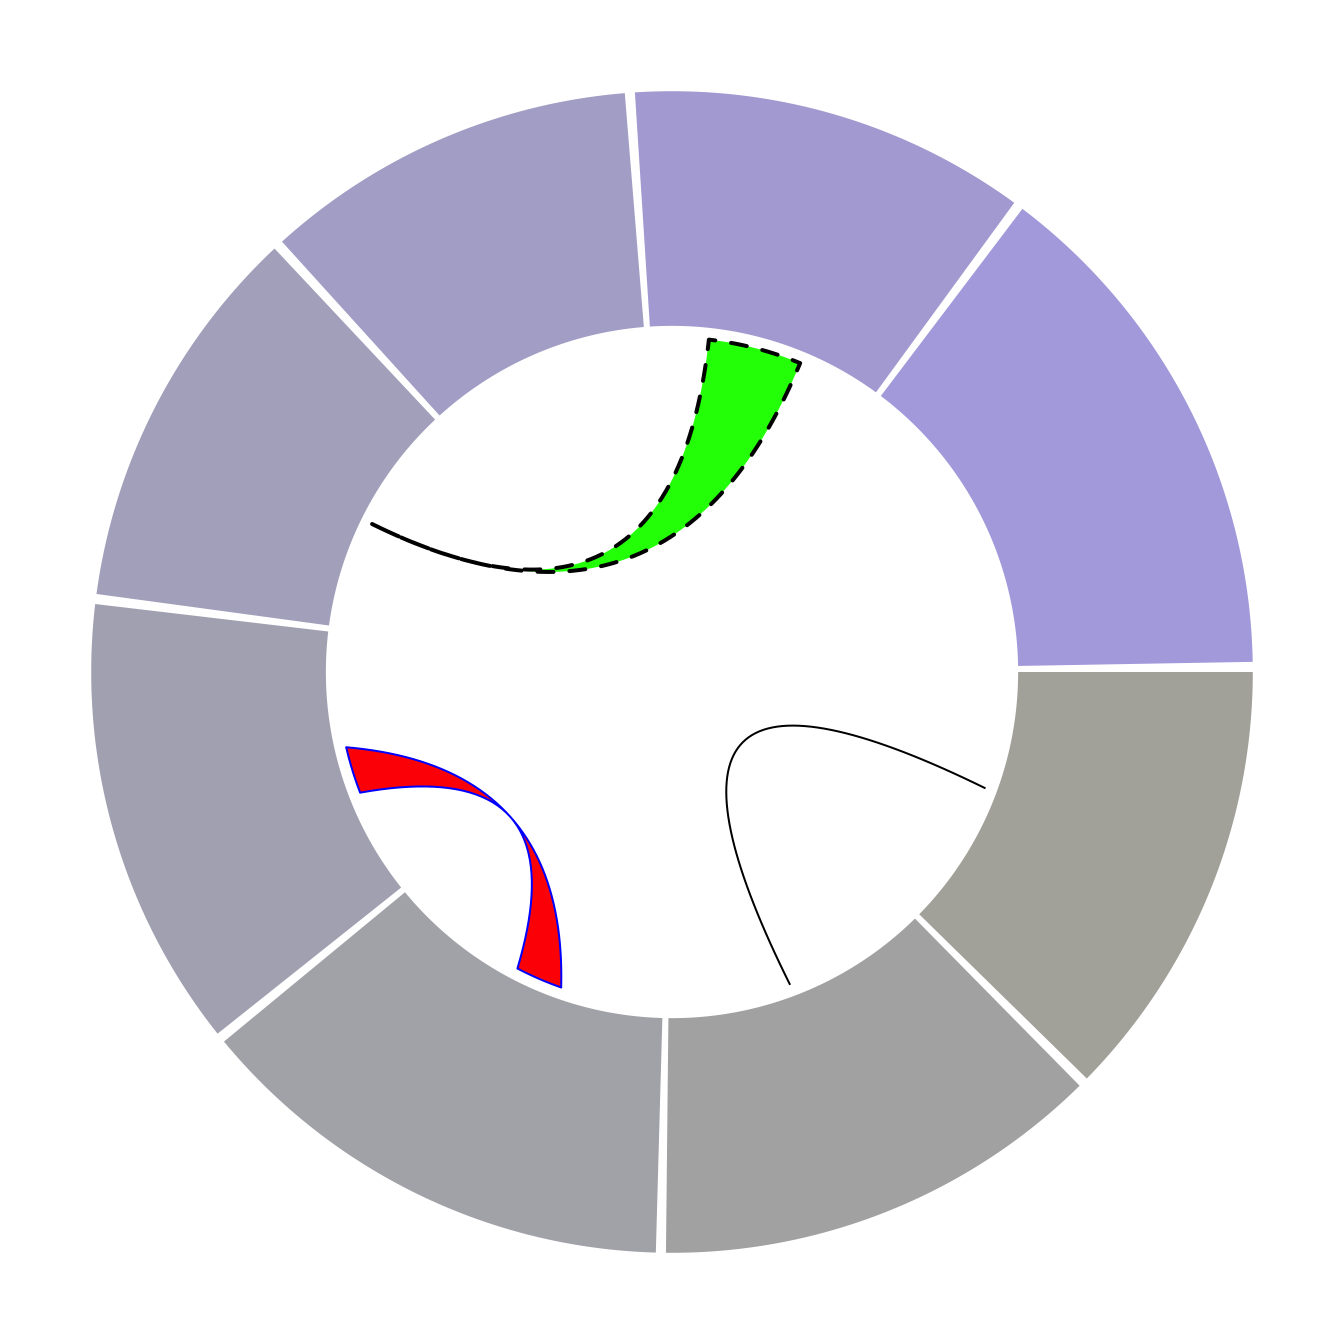
It is possible to add connections between tracks with
circos.links().
See chart #122 for a customized version, and chart #123 for an automatized version.
# library
library(circlize)

# Create data
set.seed(123)
data = data.frame(
    factor = sample(letters[1:8], 1000, replace = TRUE),
    x = rnorm(1000),
    y = runif(1000)
    )

# Initialize the plot.
par(mar = c(1, 1, 1, 1) )
circos.initialize(factors = data$factor, x = data$x )

# Build the regions of track #1
circos.trackPlotRegion(factors = data$factor, y=data$y , bg.col = rgb(0.1,0.1,seq(0,1,0.1),0.4) , bg.border = NA)

# Add a link between a point and another
circos.link("a", 0, "b", 0, h = 0.4)

# Add a link between a point and a zone
circos.link("e", 0, "g", c(-1,1), col = "green", lwd = 2, lty = 2, border="black" )

# Add a link between a zone and another
circos.link("c", c(-0.5, 0.5), "d", c(-0.5,0.5), col = "red", border = "blue", h = 0.2)