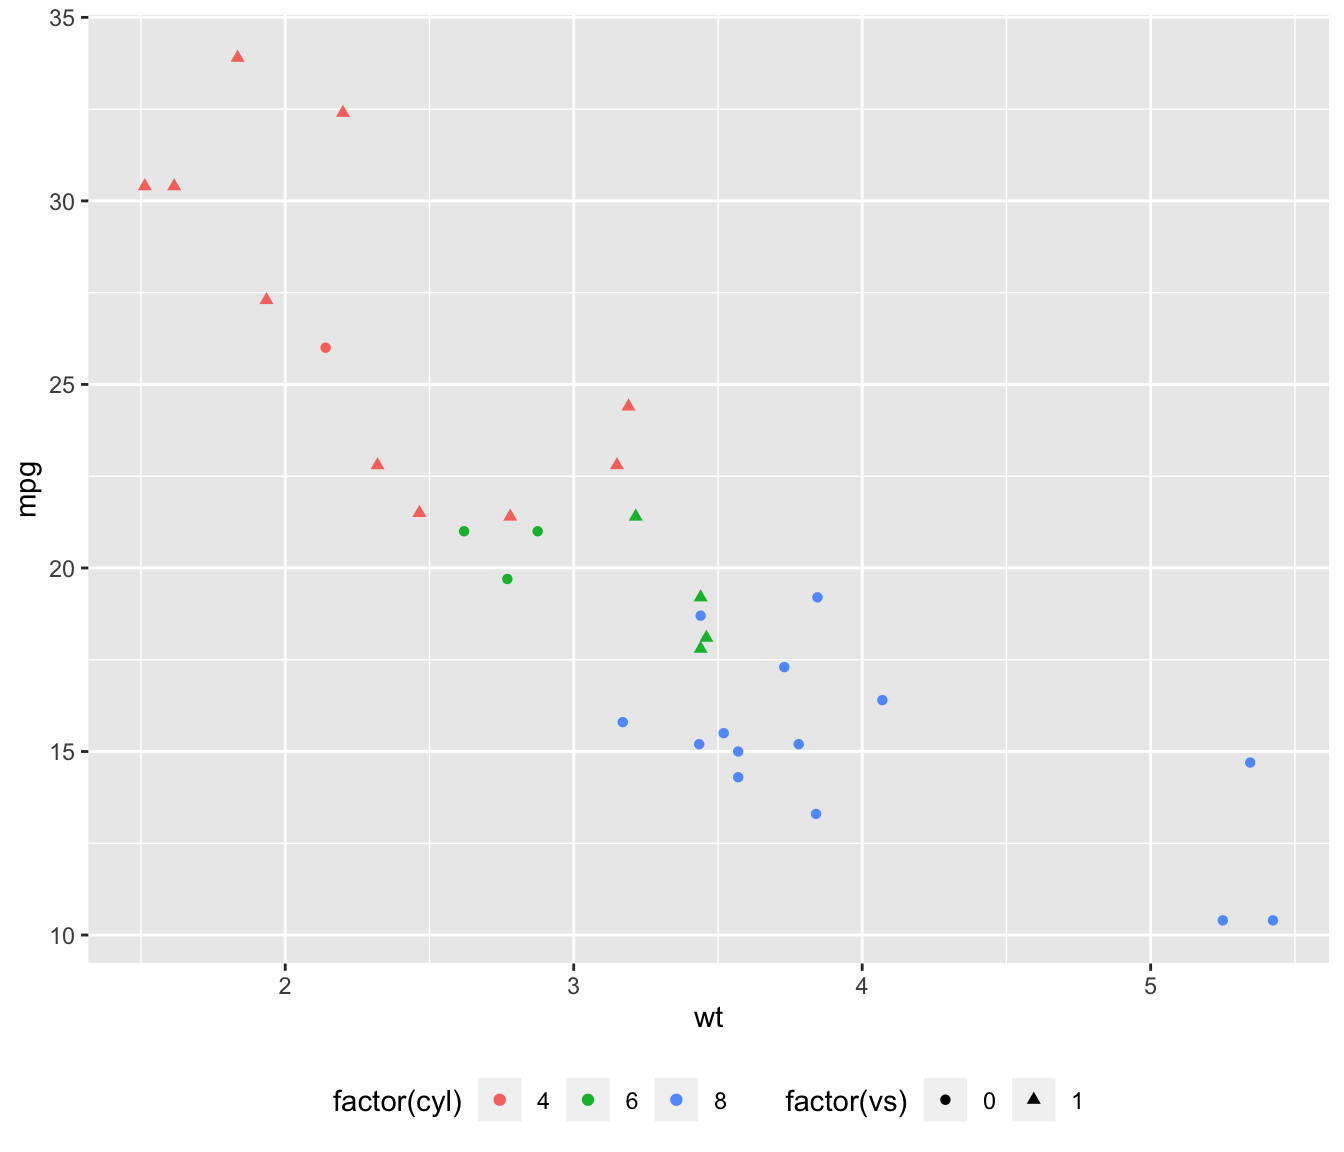
Default legend with ggplot2
By default, ggplot2 will automatically build a legend
on your chart as soon as a shape feature is mapped to a variable in
aes() part of the ggplot() call. So if you
use color, shape or alpha, a
legend will be available.
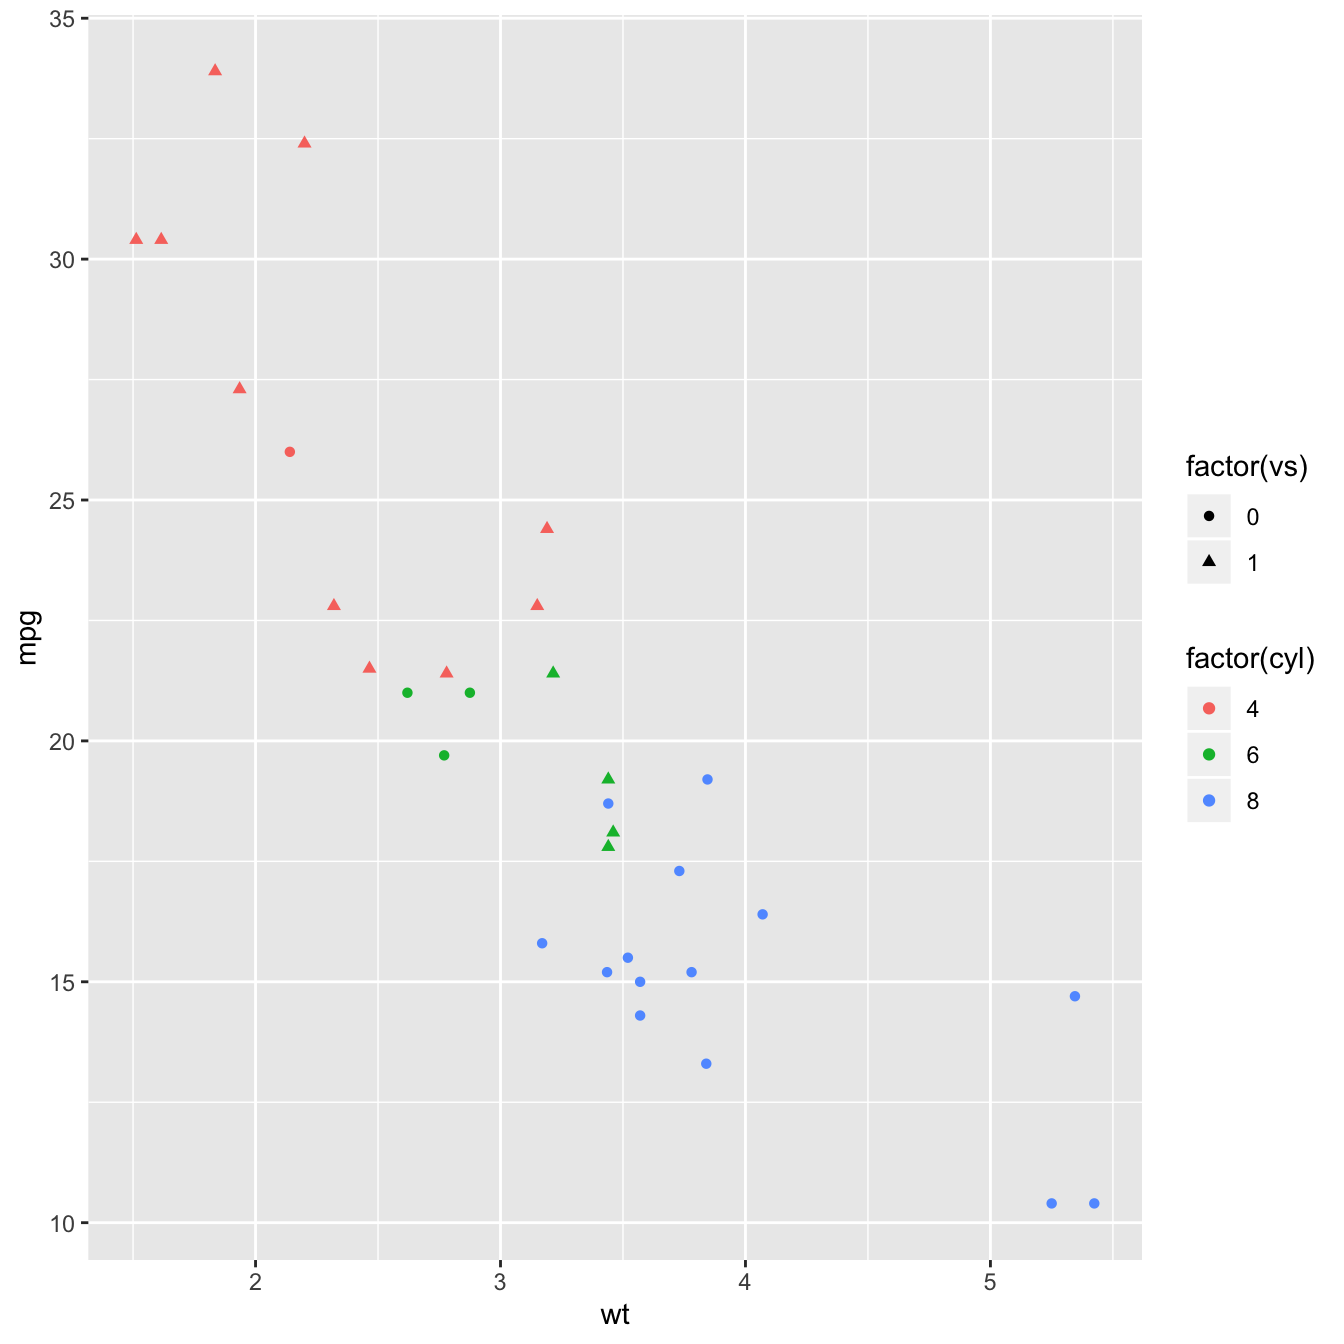
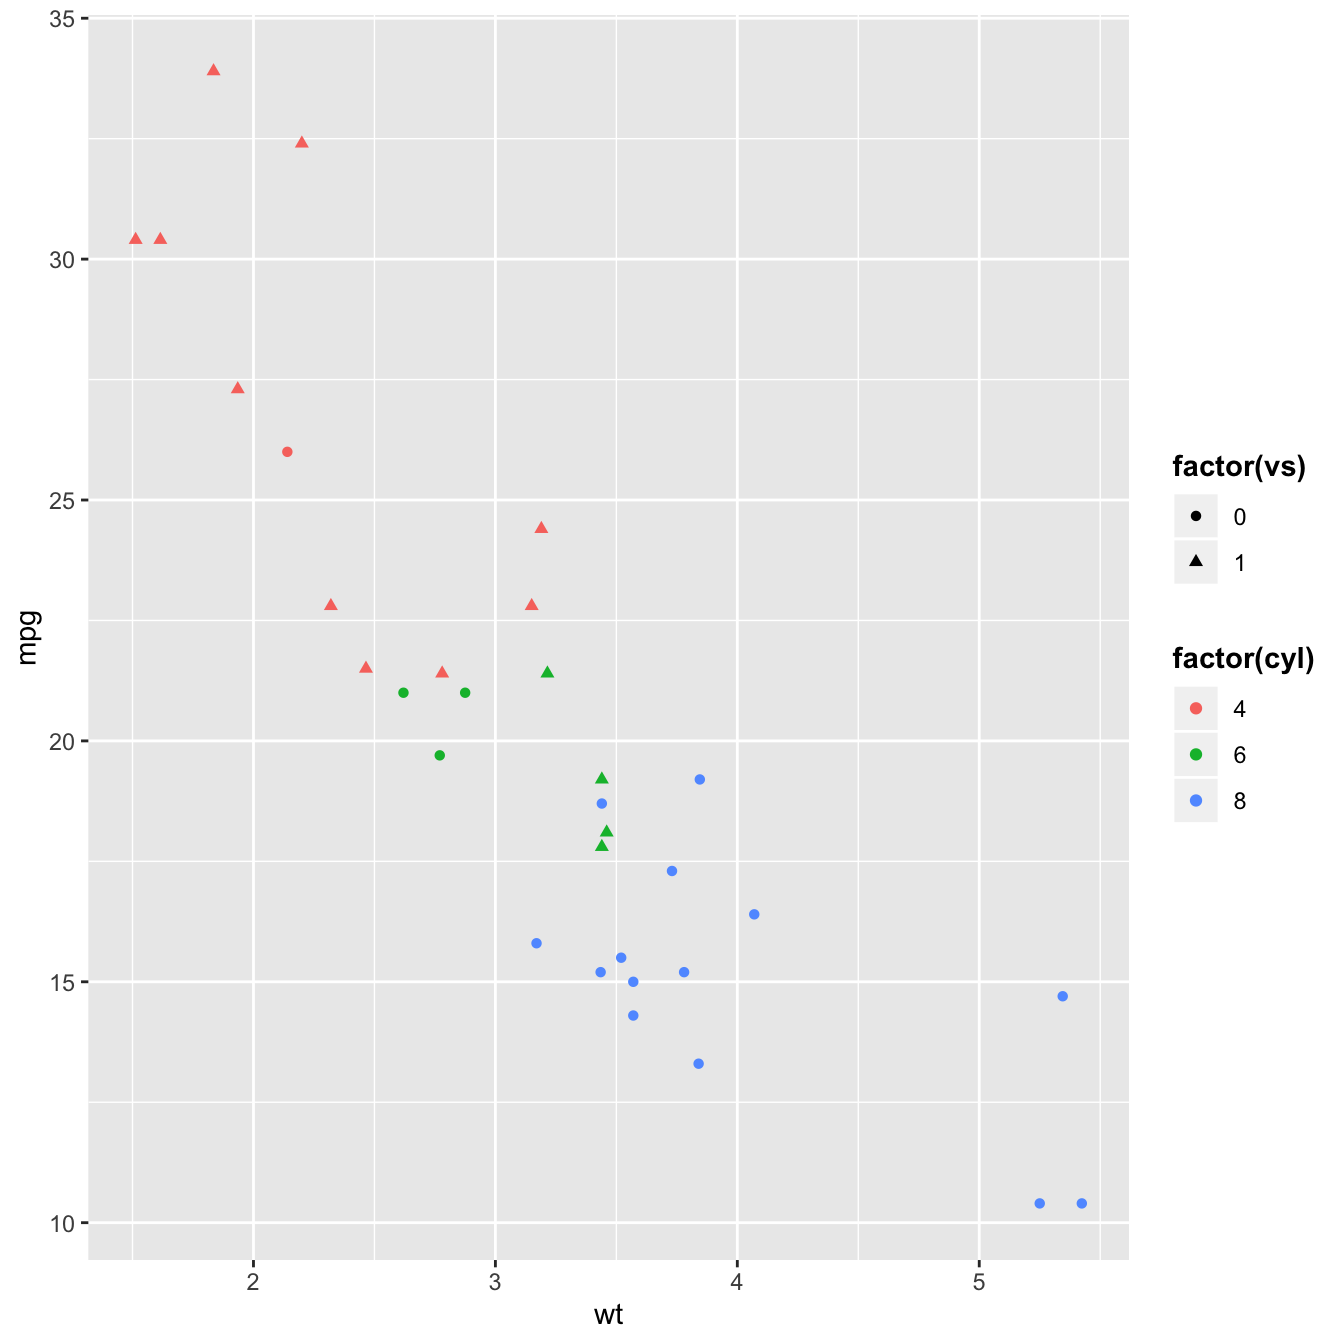
Here is an example based on the mtcars dataset. This
post is gonna show how to use the theme() function to
apply all type of customization on this default legend.
Note : this post is strongly inspired by the doc you get
typiinig ??ggplot2::theme, give it a go!
# Load ggplot2
library(ggplot2)

# Very basic chart
basic <- ggplot(mtcars, aes(wt, mpg, colour = factor(cyl), shape = factor(vs) )) +
       geom_point()
basic
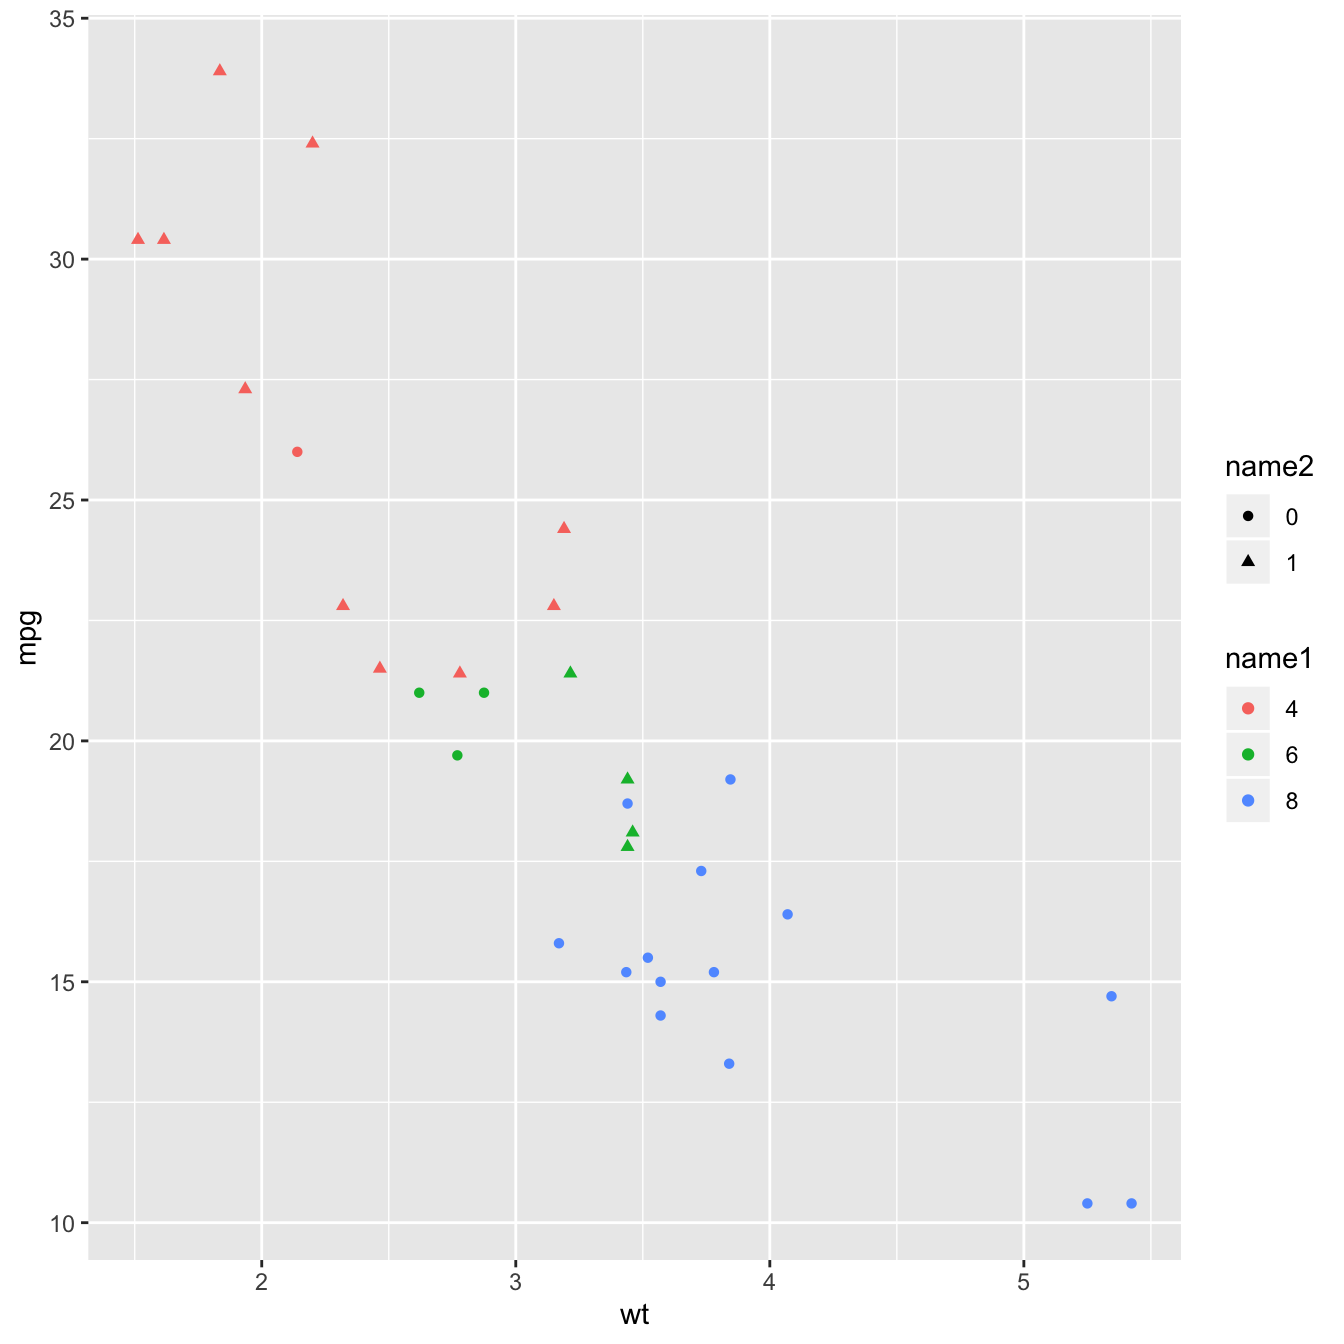
Change legend title with labs()
The labs() function allows to change the legend titles.
You can specify one title per section of the legend, i.e. per
aesthetics in use in the chart.
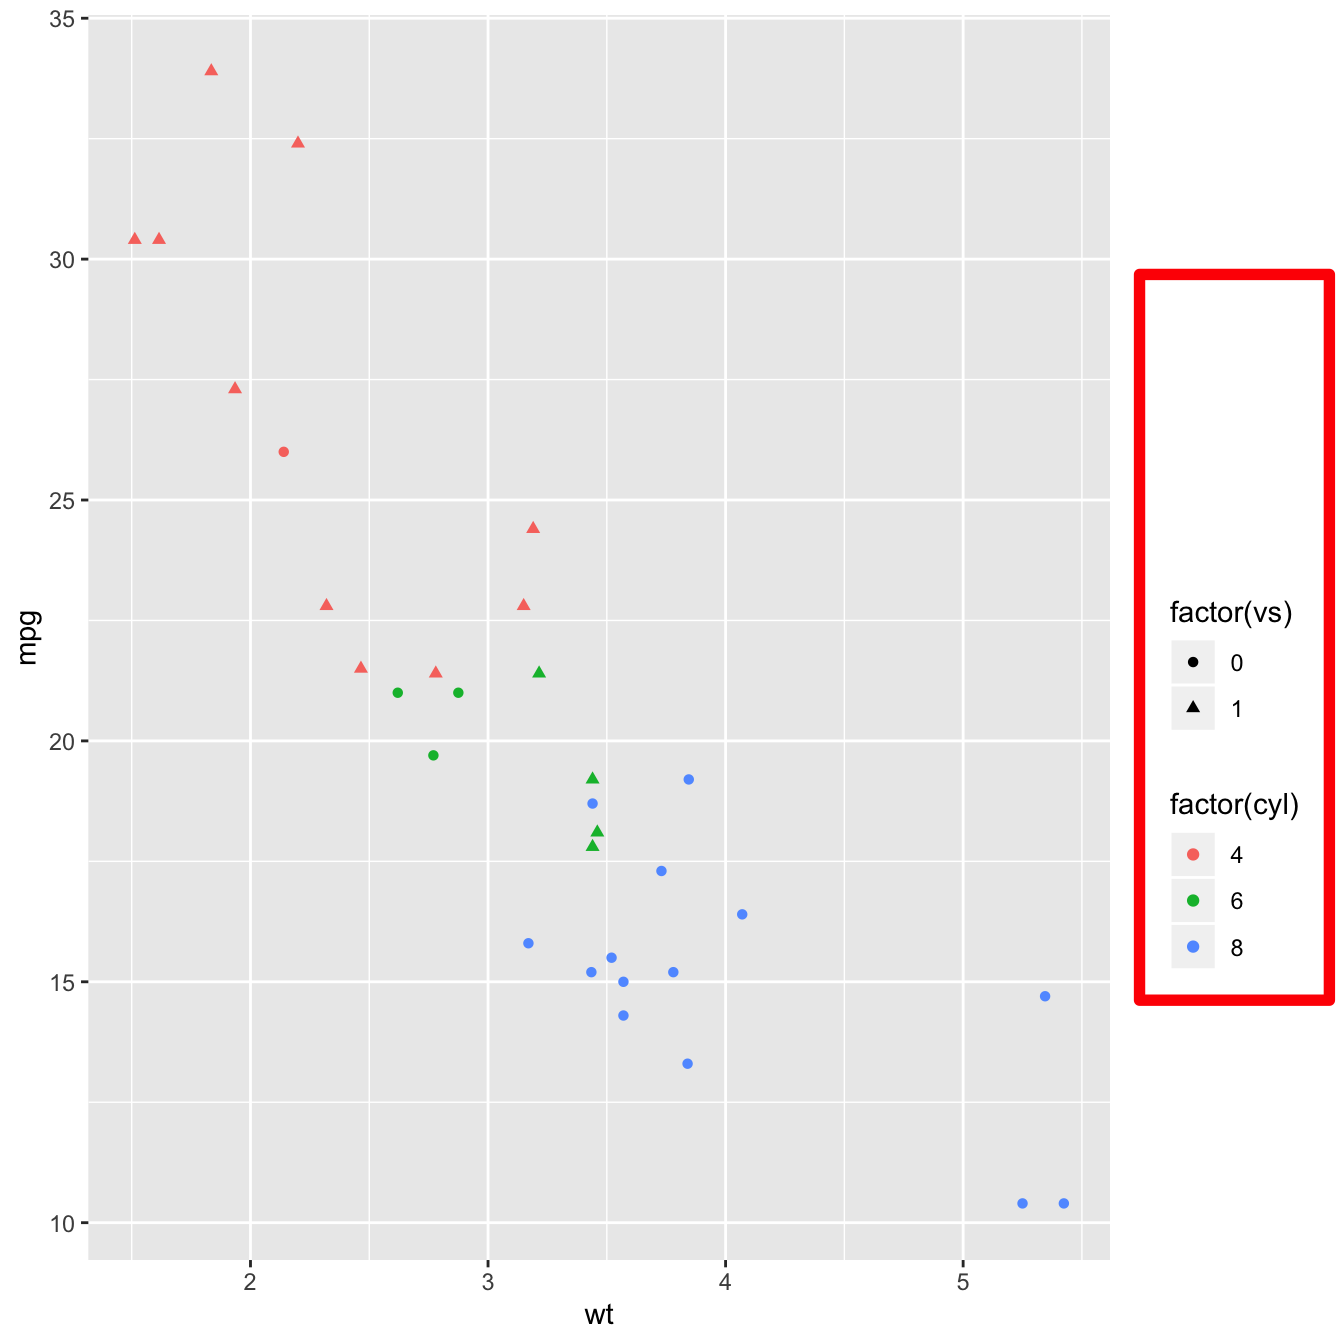
Get rid of the legend: guides() and theme()
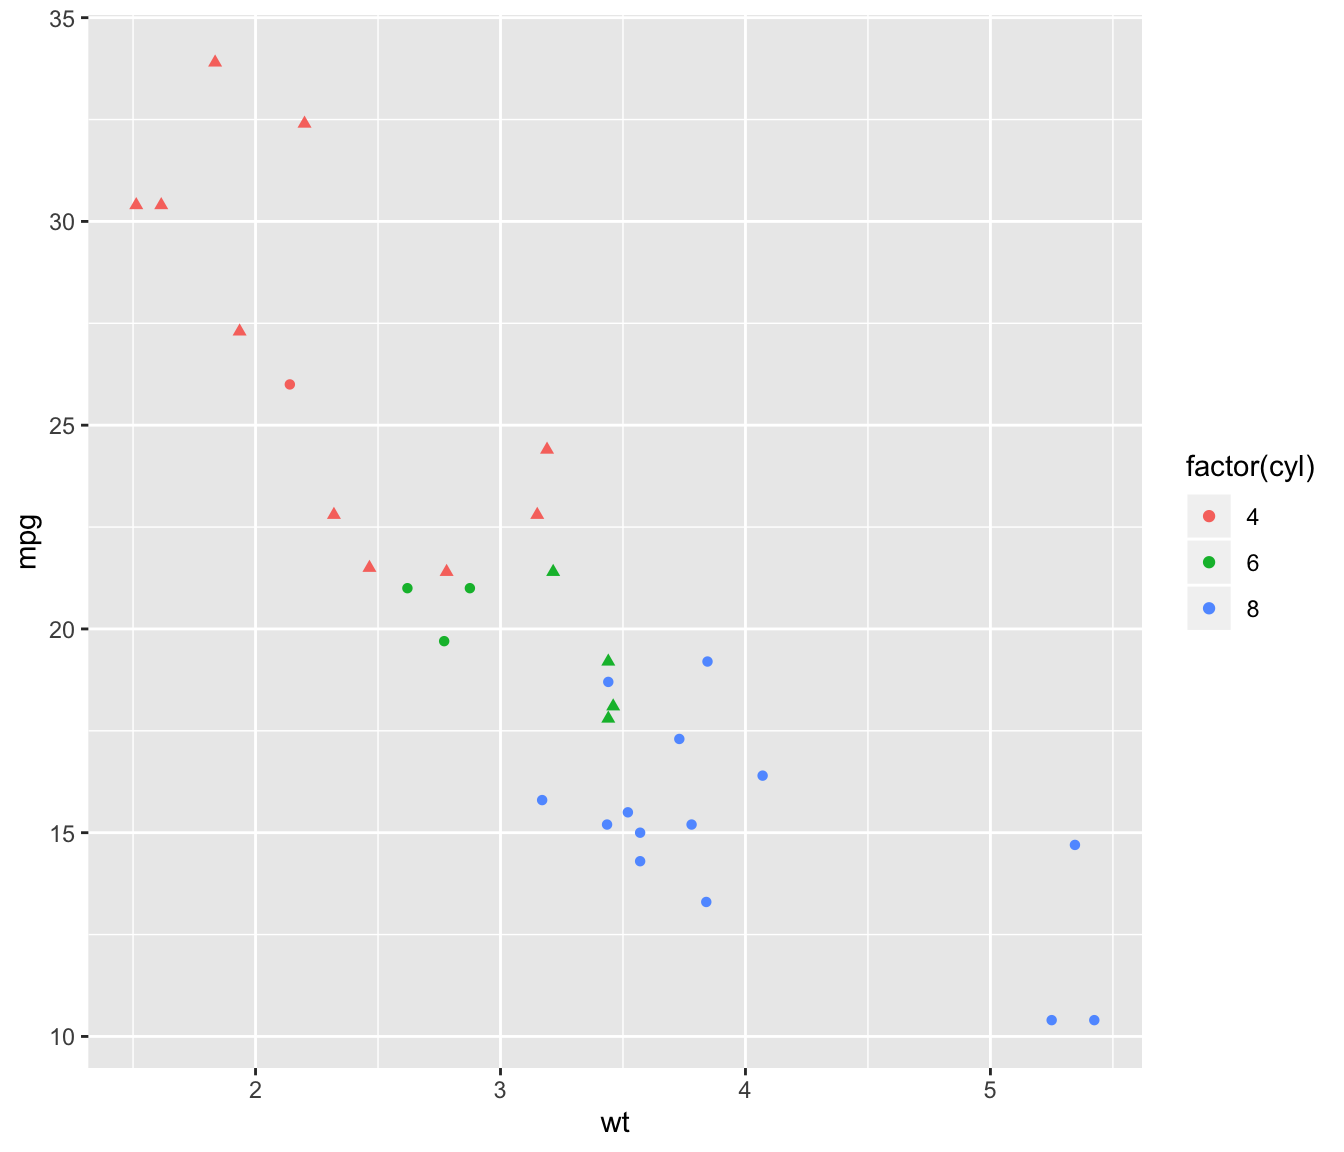
It is possible to remove a specific part or the whole legend thanks to
the theme() and the guides() function. See
code below:
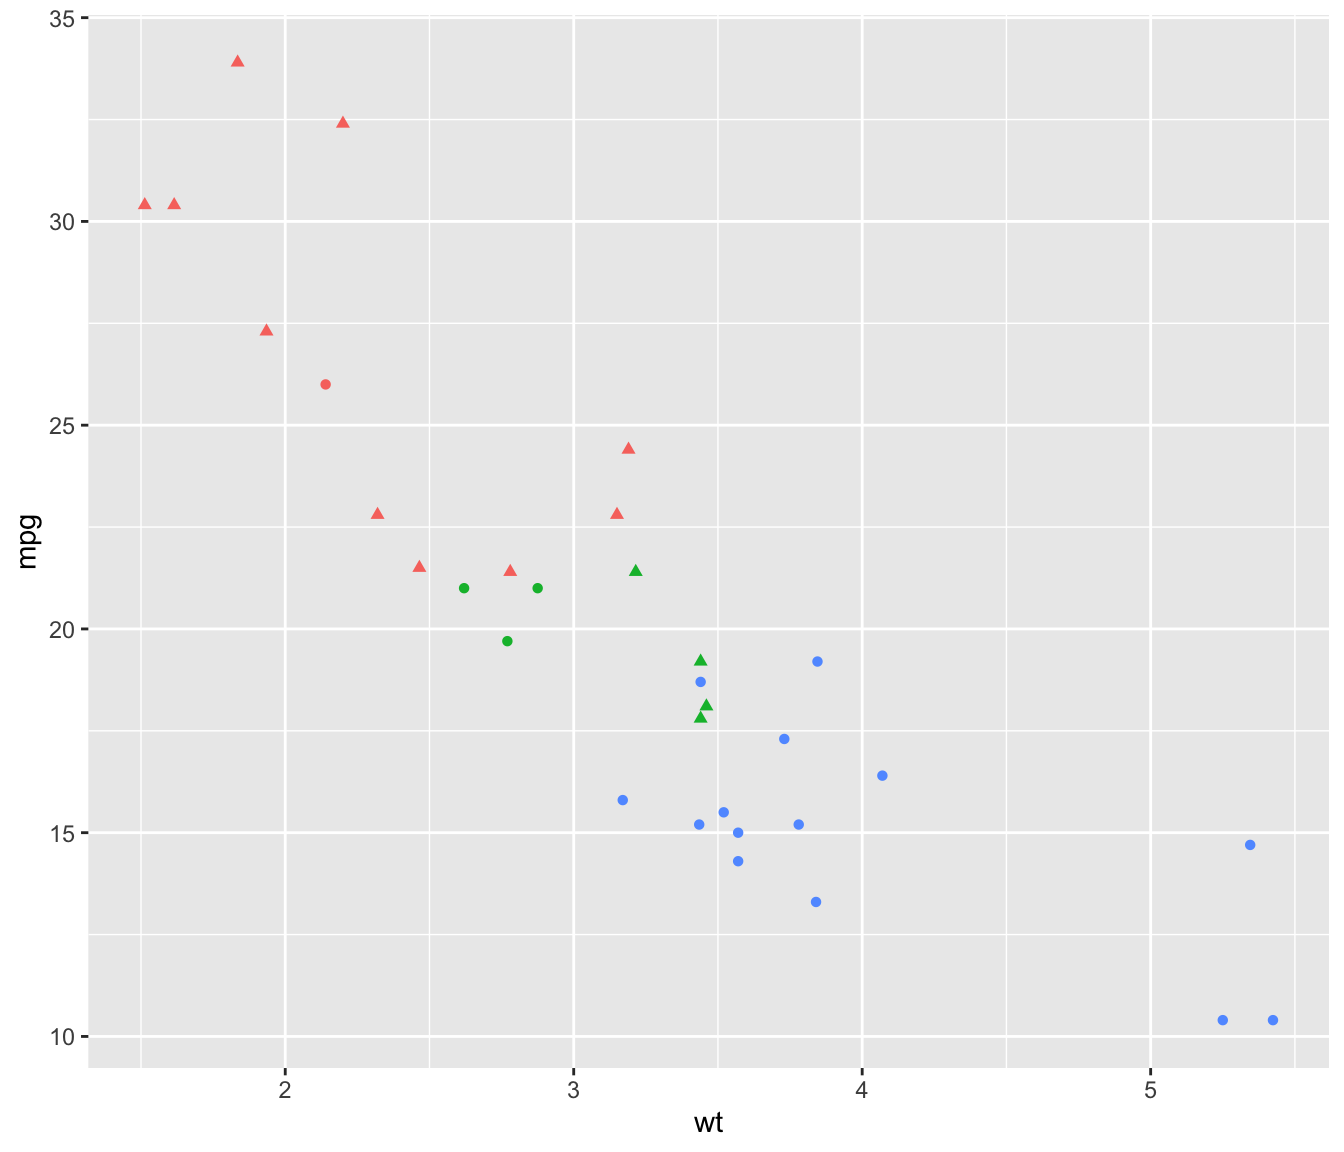
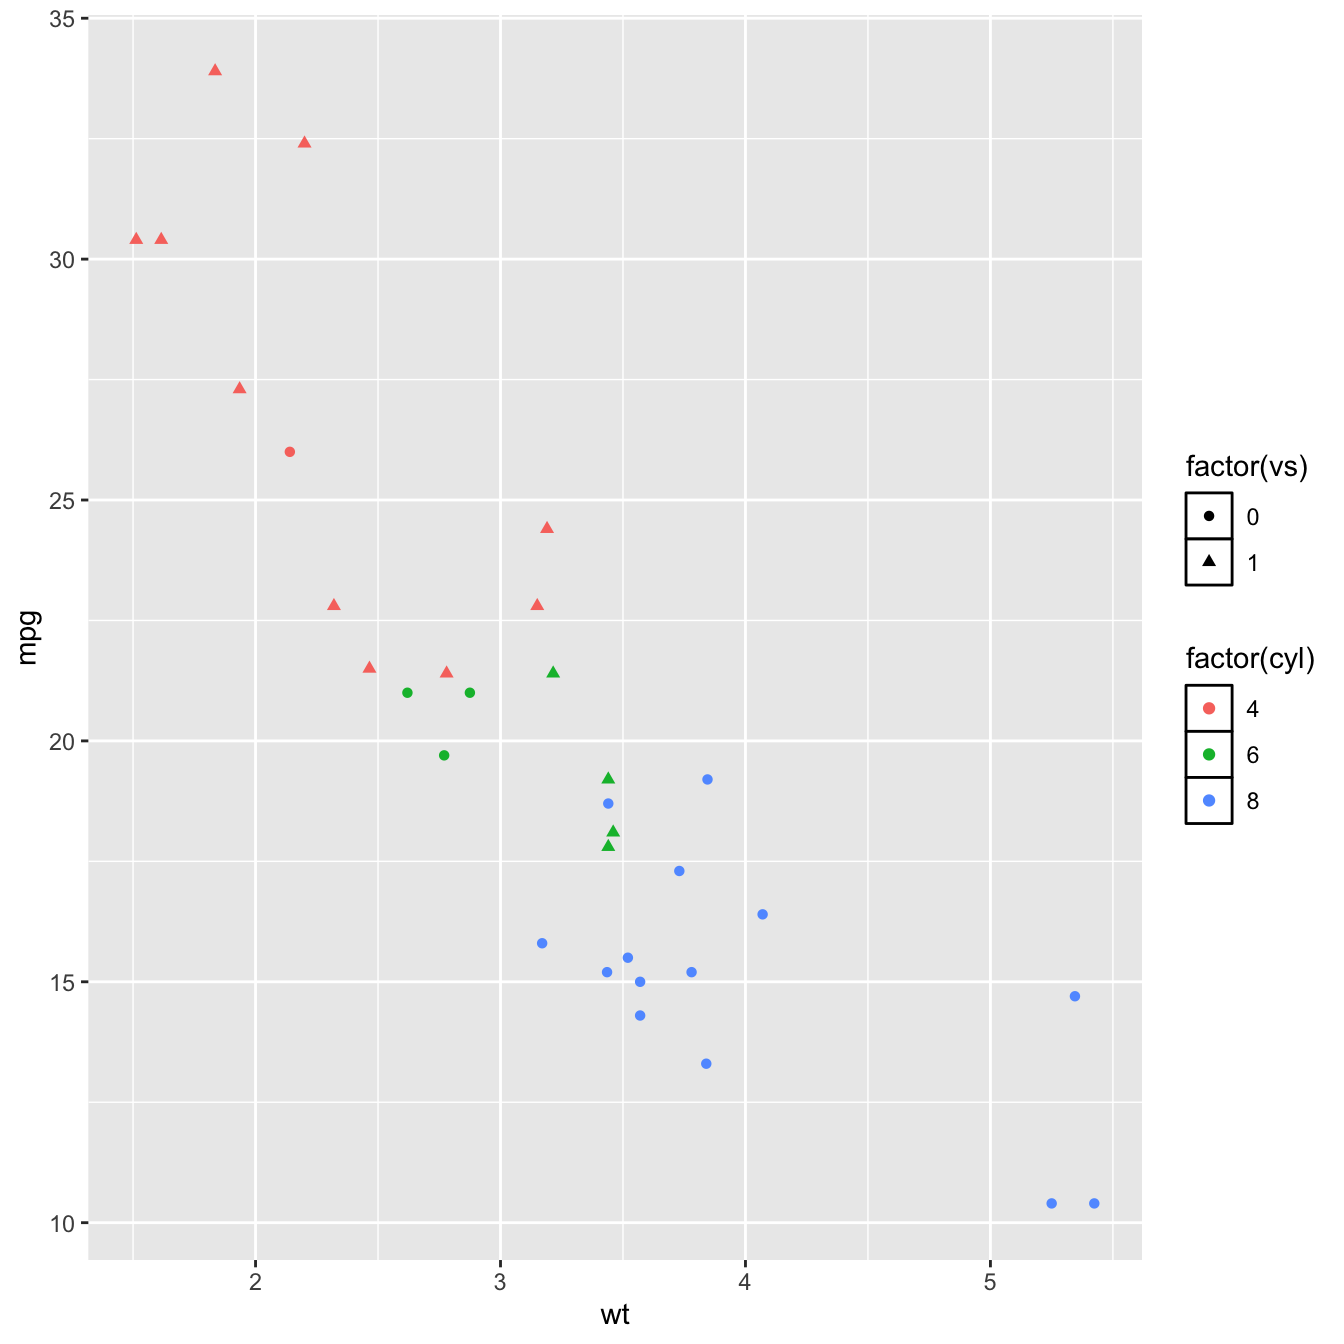
Control legend position with legend.position

You can place the legend literally anywhere.
To put it around the chart, use the legend.position option
and specify top, right, bottom,
or left. To put it inside the plot area, specify a vector
of length 2, both values going between 0 and 1 and giving the x and y
coordinates.
Note: the command legend.justification sets the corner that
the position refers to.
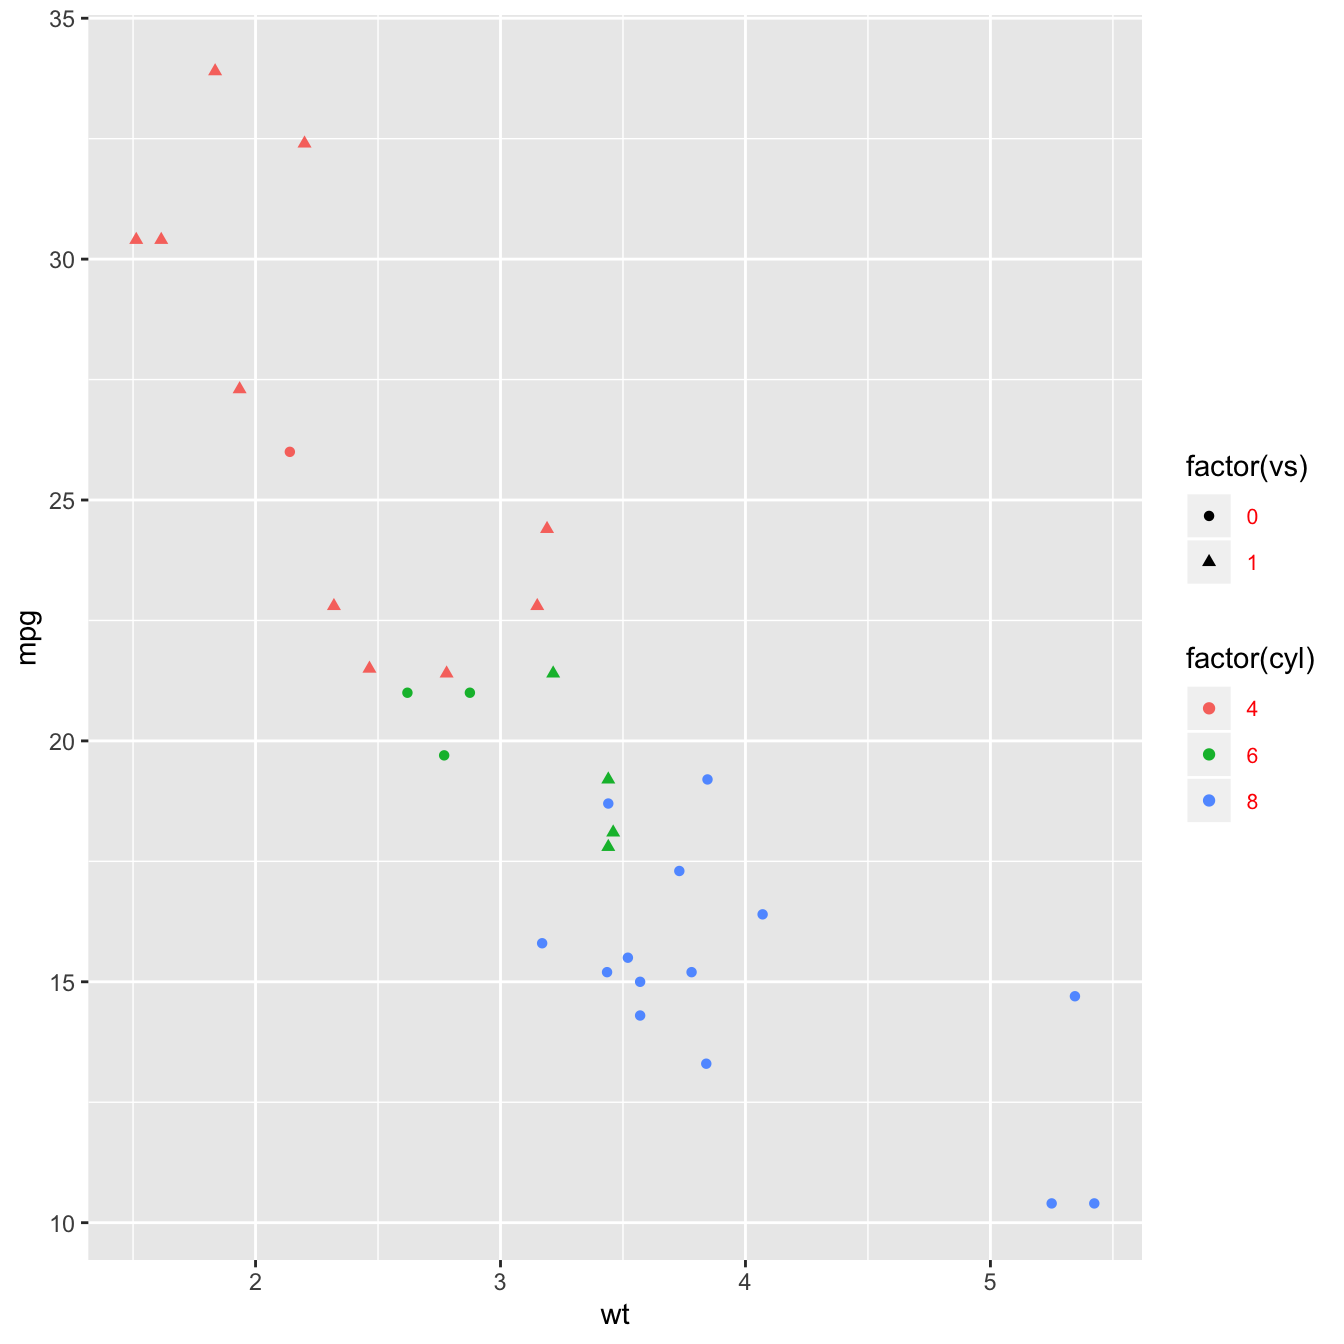
# Right -> inside the plot area
basic + theme(
    legend.position = c(.95, .95),
    legend.justification = c("right", "top"),
    legend.box.just = "right",
    legend.margin = margin(6, 6, 6, 6)
    )
Legend appearance
Here are 4 examples showing how to customize the legend main features:
-
box with
legend.box.: it is a rectangle that frames the legend. Give features withelement_rect() -
key with
legend.key: the key is the part showing the symbols. Note that symbols will automatically be the ones used on the chart -
text with
legend.text: here you can control the color, the size of the right part of the legend - title with
legend.title.