Treemap package
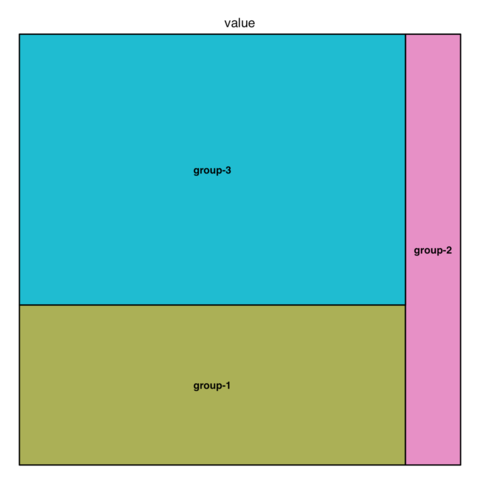
The treemap package is probably the best way to build
treemaps in R. The 3 examples below will teach you how to build a very
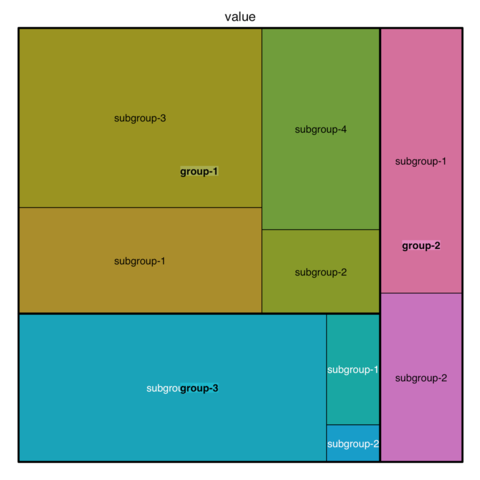
basic treemap, how to deal
with subgroups, and how to
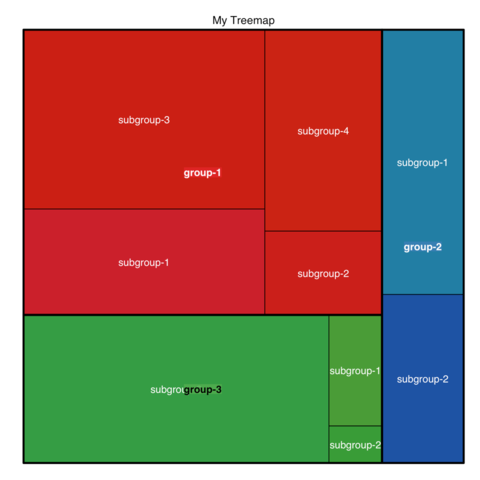
customize the figure. Note that
once you master this package, you can very easily build an interactive
version as described below.
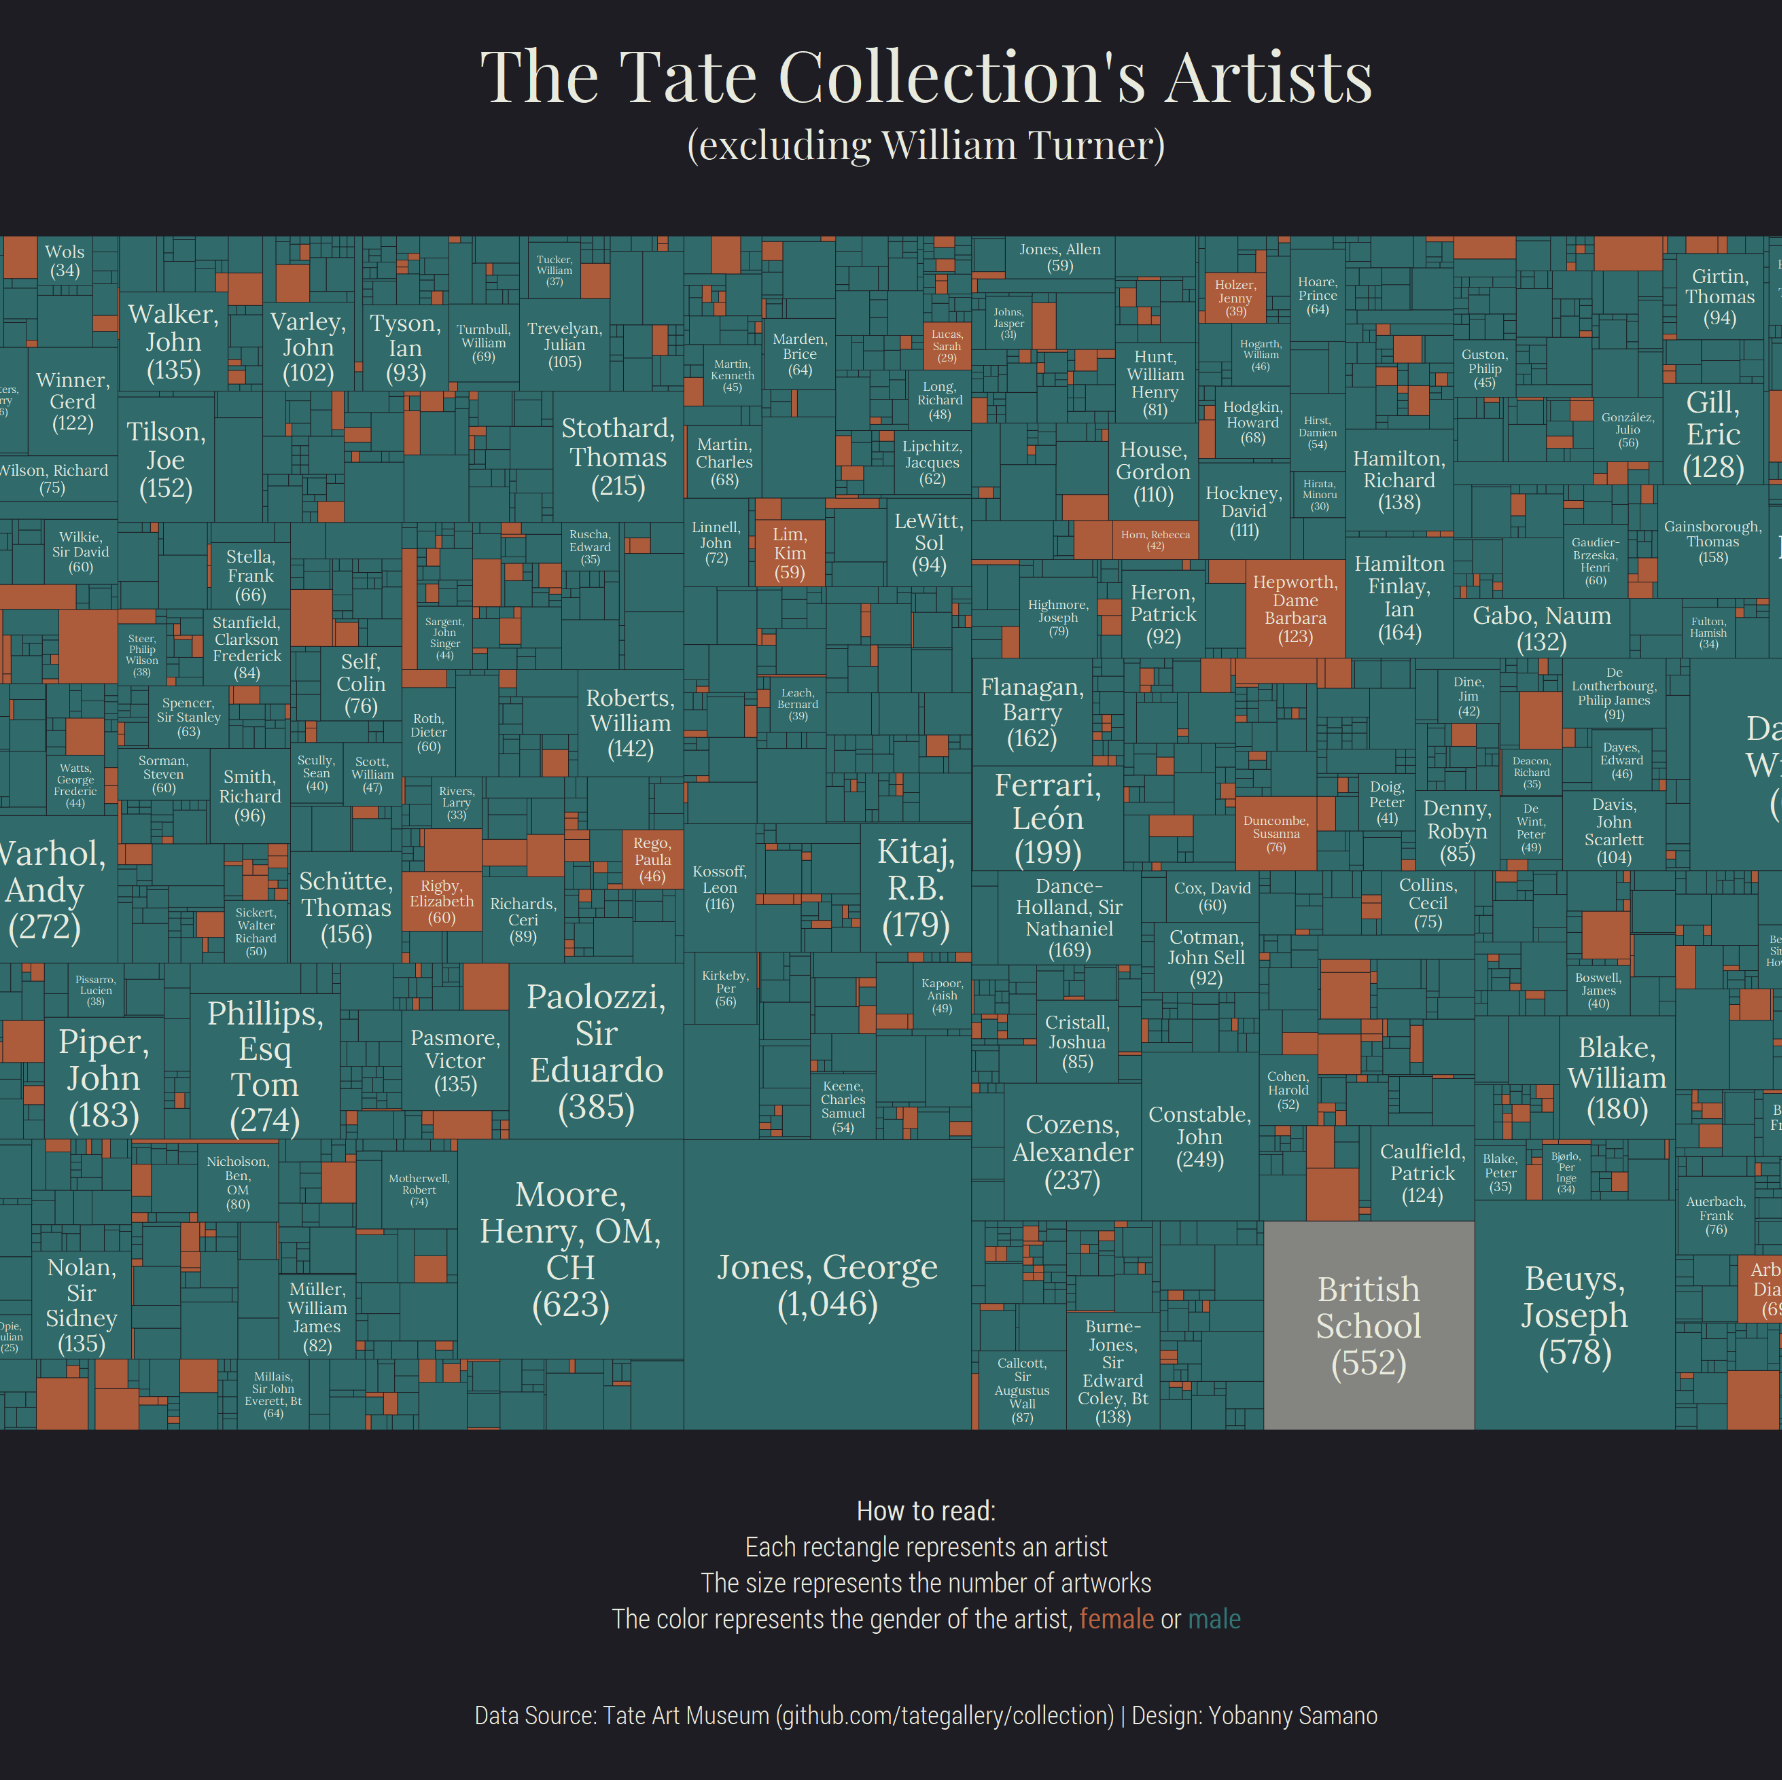
Using the treemap package, with the right packages and
data allows you to build very interesting treemaps. Here are some
examples:
d3treeR
The d3treeR allows to build interactive treemaps with
R. Click on a group to zoom in and reveal subgroups.
Click on the group name on top to unzoom and come back to the previous
state. Note that the syntax used in previous charts above is exactly
the same. Only one more line of code is needed, give it a go!