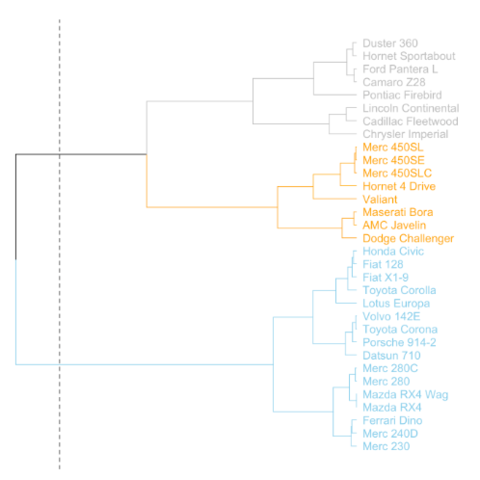
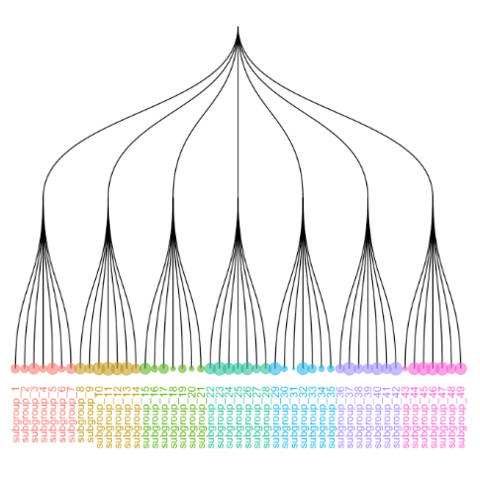
hierarchical data.
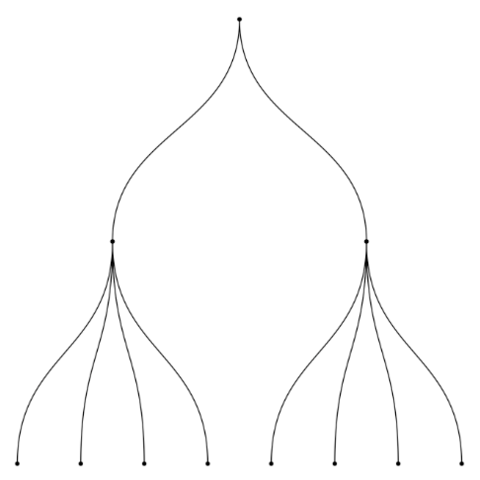
The ggraph package is the best option to build a
dendrogram from hierarchical data with R. It is based on the grammar
of graphic and thus follows the same logic that ggplot2.
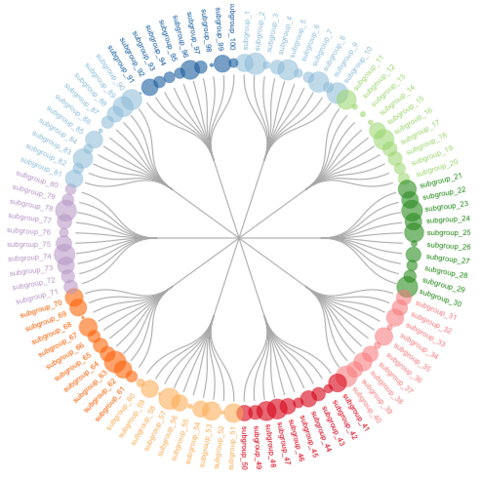
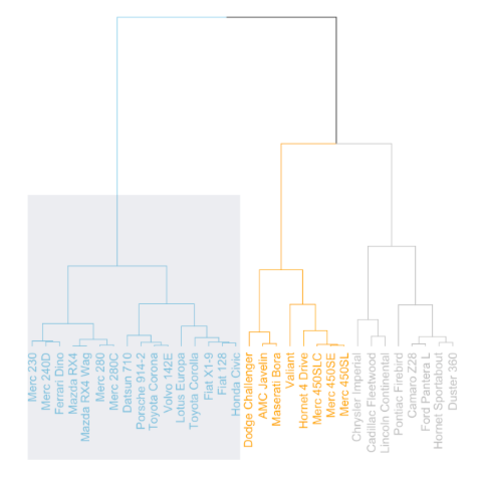
The collapsibletree package is an htmlwidget: it
automatically builds collapsible interactive tree diagram. On the
chart below, click a node to reveal the next branch, and zoom
in/out if necessary.
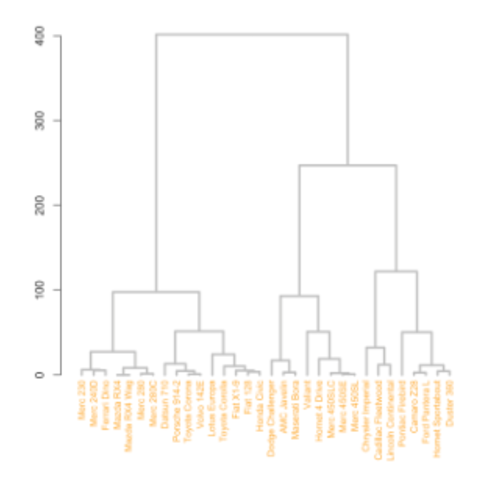
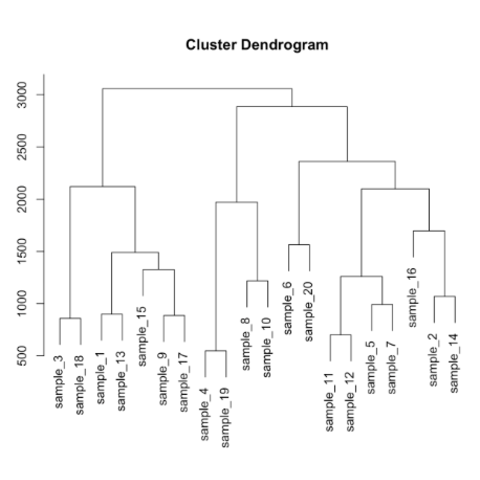
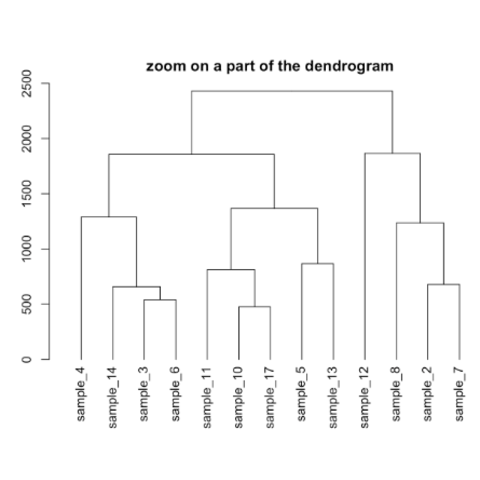
clustering result.
Hierarchical clustering is a common task in data science and can be
performed with the hclust() function in R. The following
examples will guide you through your process, showing how to prepare
the data, how to run the clustering and how to build an appropriate
chart to visualize its result.
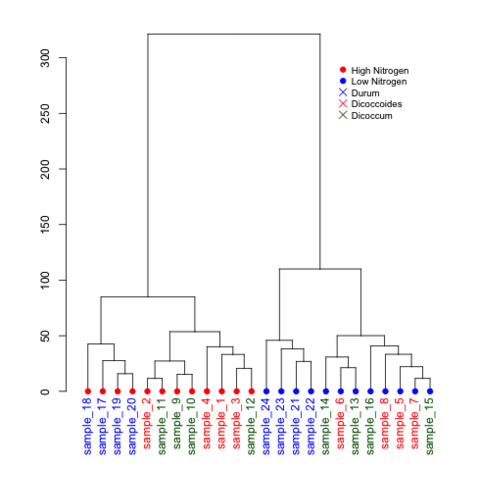
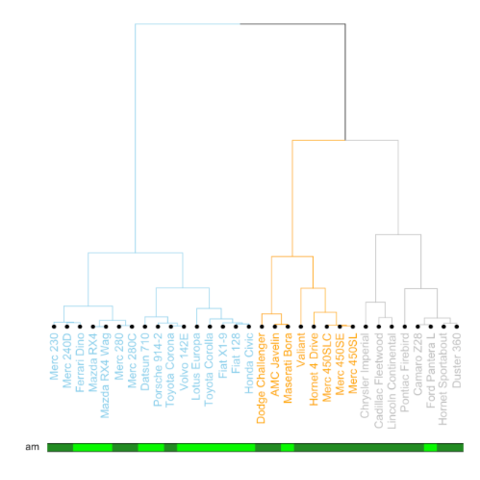
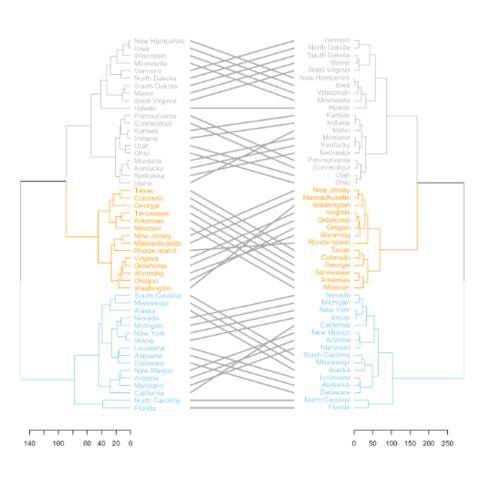
dendextend.
The dendextend package allows to go one step further in
term of dendrogram customization. Here is a set of examples showing
the main possibilities, like adding color bar on the bottom, drawing 2
trees face to face and more.